Week 22 delivered $32,459,995 in rug pull extraction on PancakeSwap V2 — virtually identical to Week 21’s $32,422,973. The 0.1% difference is statistically noise. Two consecutive weeks at the same extraction level is not a coincidence — it is the rug pull industry finding its operational floor after the W20 spike cycle. The running 22-week total now stands at $634,827,407.
The plateau is not good news. A $32.5M weekly floor means retail investors on PancakeSwap V2 are losing approximately $4.6M every single day — without headlines, without emergency responses, and without industry-wide concern.
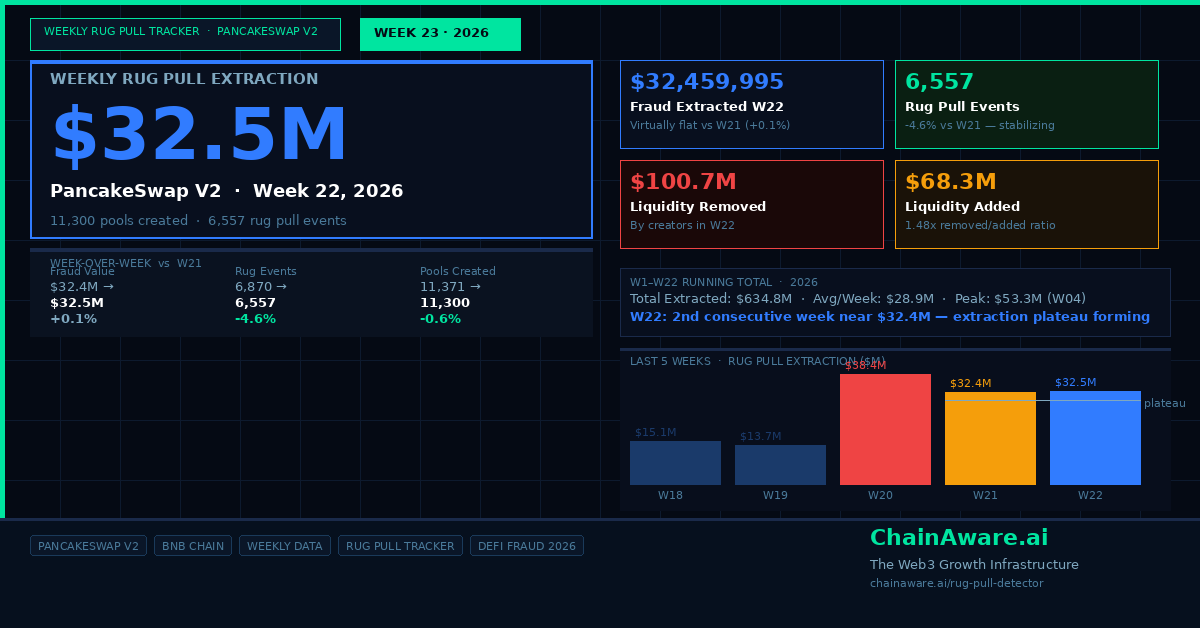
This Week’s Numbers — Week 22, 2026 · PancakeSwap V2
The Plateau: What Two Flat Weeks Signal
The compression-then-spike-then-plateau pattern is now clearly visible in the 22-week dataset. Week 20 produced the largest WoW spike in the dataset (+179.9%). Week 21 saw the fraud value pull back slightly while rug events hit an 8-week high. Week 22 is essentially identical to Week 21 — both in fraud value and event count direction. This is how extraction cycles end: not with a dramatic collapse but with a gradual compression toward a new operating baseline.
| Week | Pools | Rug Events | Added | Removed | Fraud Value | WoW |
|---|---|---|---|---|---|---|
| 2026-W18 | 8,126 | 3,733 | $33.1M | $48.2M | $15,115,444 | — |
| 2026-W19 | 10,147 | 3,199 | $27.7M | $41.3M | $13,676,254 | −9.5% |
| 2026-W20 | 11,066 | 5,518 | $51.6M | $90.1M | $38,425,423 | +181.0% |
| 2026-W21 | 11,371 | 6,870 | $69.8M | $102.3M | $32,422,973 | −15.6% |
| 2026-W22 ≈ | 11,300 | 6,557 | $68.3M | $100.7M | $32,459,995 | +0.1% |
Reading the Plateau
The removed-to-added liquidity ratio held steady at 1.48x in W22 vs 1.46x in W21. Both are well above the 1.0x break-even threshold — creators continue extracting 48% more than they seed on average. Pool creation is stable at 11,300 vs 11,371. Every metric points to operational steadiness rather than either expansion or contraction.
The 5-week trailing average (W18–W22) now stands at $26.4M — still below the 22-week mean of $28.9M, but climbing steadily as the low-extraction weeks of W17–W19 drop further back in the rolling window. By W23 the trailing average will cross $27M unless extraction drops significantly. The 22-week mean of $28.9M represents the structural extraction capacity of the PancakeSwap V2 rug pull industry when operating at normal intensity. The current plateau at $32.5M is running above that mean — not below it.
Two weeks at $32.4M–$32.5M also suggests the W20 spike operators have not fully exited — they have compressed activity while maintaining elevated baseline extraction. The compression-then-spike cycle that produced W20 typically repeats. Based on the W3–W8 and W13–W20 cycle patterns, the next acceleration window opens somewhere in W24–W26. For the full cycle analysis and the original 20-week dataset, see our $569M PancakeSwap V2 analysis.
22-Week Running Total: $634.8M
| Metric | W1–W22 Total |
|---|---|
| Total rug pull events | 119,216 |
| Net retail losses | $634,827,407 |
| Average weekly extraction | ~$28.9M |
| 5-week trailing avg (W18–W22) | ~$26.4M |
| Peak week | W04 — $53,285,613 |
| Current plateau level | ~$32.4M (W21–W22) |
How to Protect Yourself
At $32.5M per week, the math is straightforward: 6,557 rug pulls across 11,300 new pools means roughly 58% of all new pools created in W22 ended in a confirmed rug pull event. Before investing in any new token or pool on PancakeSwap V2, run ChainAware’s free tools:
- Rug Pull Detector V3 — behavioral analysis of the contract creator + smart contract code inspection. 90.1% prediction accuracy. Free, no signup.
- Fraud Detector — full behavioral history of any deployer wallet. 98% fraud prediction accuracy.
- Wallet Auditor — for P2P transactions. Complete behavioral profile of any receiving wallet before sending funds.
About This Tracker
The ChainAware Weekly Rug Pull Tracker measures the most basic, mathematically verifiable form of rug pull on PancakeSwap V2: a contract creator adds liquidity (Mint event), retail investors buy in, and the creator removes more than they added (Burn event). The difference is confirmed retail loss. This definition is conservative — it excludes LP token transfer rug pulls, unlocked token sell-offs, honeypot contracts, and associated wallet extraction. Numbers reported here represent the confirmed floor. For complete methodology, see chainaware.ai/resources/rugpull-verification ↗.