A DeFi protocol spending $1,000 on a marketing campaign — KOL promotion, Discord activation, Twitter advertising — typically knows one thing at the end: how many wallets connected. What they don’t know is how many of those wallets actually transacted, which campaign drove which connections, whether those connections represent genuine long-term users or airdrop farmers, and whether any of the spend was efficient.
This measurement gap is not a minor reporting inconvenience. It is a fundamental strategic blindspot that causes teams to double down on expensive campaigns that are acquiring the wrong users, abandon effective strategies because the right users are hard to count, and optimize for vanity metrics that say nothing about protocol health or sustainable growth.
The root cause is structural: Web3 marketing is being measured with Web2 tools. Google Analytics, Facebook Pixel, and traditional attribution frameworks were built for environments where users have persistent identities, cookies track behavior across sessions, and “conversion” means a form fill or a purchase. None of these assumptions hold in Web3. Wallets are not users. Sessions don’t persist across wallet connections. Conversion is a wallet interaction that may mean nothing about long-term engagement.
This guide is the complete framework for Web3-native marketing analytics: how to measure what actually matters, attribute campaigns to real outcomes, segment users by behavioral quality, and optimize spend allocation based on LTV rather than wallet count.
In This Guide
- The Web3 Marketing Measurement Problem
- Why Traditional Web2 Metrics Fail in Web3
- Web3-Native Metrics That Actually Matter
- How to Measure Campaign Effectiveness
- Attribution in Anonymous Web3
- ROI Calculation Framework
- Case Study: $20K Budget Optimization
- Tools & Implementation
- FAQ
The Web3 Marketing Measurement Problem
The scale of the measurement problem in Web3 marketing becomes clear when you look at what teams are spending versus what they can actually measure. According to research compiled by Usermaven’s 2026 marketing benchmarks, mature SaaS and digital product companies typically spend 7–12% of revenue on marketing and can attribute 70–85% of conversions to specific channels. Web3 protocols, by contrast, commonly spend 20–40% of their treasury on growth with less than 20% attribution capability — meaning the vast majority of marketing spend produces outcomes that cannot be measured, evaluated, or optimized.
The consequences of this measurement gap compound over time. Without attribution data, teams cannot identify which acquisition channels are cost-effective — so they default to high-visibility spend (KOL campaigns, paid Twitter promotion) that is easy to execute but produces the worst ratio of genuine users to reward hunters. Without segment-level quality data, they optimize for total wallet connections rather than quality user acquisition — a metric that rewards farming campaigns over genuine adoption campaigns. Without retention data by cohort, they cannot distinguish between campaigns that produced 30-day flash engagement and campaigns that built genuine long-term users.
The teams that break out of this cycle share a common characteristic: they have instrumented their platforms with Web3-native analytics tools that read on-chain behavioral data, giving them visibility into user quality, campaign attribution, and retention that Web2 analytics fundamentally cannot provide. For a detailed overview of how Web3 behavioral analytics works at the technical level, see our ChainAware Web3 Behavioral Analytics complete guide.
What Teams Are Flying Blind On
To understand the scope of the problem, here is a typical set of questions that a Web3 marketing team cannot answer with conventional analytics — and what they would need to answer them:
- Which of our campaigns last month produced users who are still active at 90 days? Requires: cohort tracking by campaign source, correlated with on-chain wallet activity at 30/60/90 day marks.
- What percentage of our airdrop recipients were genuine DeFi participants vs. farming wallets? Requires: behavioral profiling of all airdrop recipient wallets at time of claim.
- What is our actual CAC for a high-quality user (Wallet Rank <5000) vs. a low-quality wallet? Requires: segment-level acquisition cost calculation, not blended average CAC.
- Which acquisition channel brings users with the highest LTV? Requires: channel attribution correlated with long-term behavioral engagement and transaction fee generation.
- Are our Discord campaigns attracting better or worse user profiles than our Twitter campaigns? Requires: source-tagged wallet connections with behavioral quality scoring at connection time.
Every one of these questions is answerable with Web3-native analytics. None of them is answerable with Google Analytics, Mixpanel, or any Web2 analytics tool that tracks browser sessions rather than wallet behavior.
Why Traditional Web2 Metrics Fail in Web3
The failure of Web2 analytics in Web3 is not a matter of implementation quality or tool selection — it is structural. Web2 analytics were designed around assumptions about user identity, session persistence, and conversion definition that are fundamentally incompatible with how Web3 works.
| Assumption | Web2 Reality | Web3 Reality |
|---|---|---|
| User Identity | Persistent browser cookies, email logins, device fingerprints | Wallet address — pseudonymous, multi-wallet, no cross-session persistence |
| Session Tracking | Continuous session from first visit through conversion | Each wallet connection is isolated — no session linking across visits |
| Conversion Signal | Form fill, purchase, subscription — high-intent single events | Wallet connection means nothing about intent — farmers connect thousands of wallets |
| Audience Segmentation | Demographics, interests, behavioral data from cookies/accounts | Zero demographic data — segmentation requires on-chain behavioral analysis |
| Attribution | UTM parameters → session → conversion (all linked by cookie) | UTM parameters → session → wallet address connection (broken link — wallet carries no UTM) |
| Retention Measurement | Return sessions by identified user | Same user may return with different wallet — or same wallet may be shared by different users |
The Wallet ≠ User Problem in Detail
The single most important structural difference between Web2 and Web3 analytics is the wallet-to-user relationship. In Web2, one user typically has one account (or a small number of linked accounts). In Web3, the relationship can go in both directions — and both distort analytics badly.
One user, many wallets (farmers). A sophisticated airdrop farmer may operate 50–500 wallets simultaneously, each appearing as a unique user in your analytics. A campaign that shows 2,000 new wallet connections might actually represent 40 professional farmers with 50 wallets each — not 2,000 new users. This is why wallet count is fundamentally misleading as a growth metric: it counts addresses, not people, and professionals can generate thousands of addresses at minimal cost.
Many users, one wallet (shared accounts). Conversely, a DAO treasury wallet, a shared team wallet, or a family member sharing an account represents multiple real users appearing as one wallet in analytics. This undercounts genuine engagement in specific user categories.
The post-conversion blindspot. Even if you successfully attribute a wallet connection to a specific campaign, Web2 analytics stops there. What did that wallet actually do after connecting? Did they execute transactions? Did they provide liquidity? Did they return? Did they stake tokens for 30 days or dump immediately? All of this behavior happens on-chain — and Web2 analytics has no visibility into any of it.
“Web2 analytics measures the door people walked through. Web3 analytics needs to measure what kind of DeFi participant walked through it — their behavioral history, likely intentions, and predicted lifetime value — all visible in their on-chain data before they interact with a single feature.”
Web3-Native Metrics That Actually Matter
Replacing Web2 metrics with Web3-native ones requires rethinking what you measure at every stage of the funnel — from acquisition through retention. The following are the metrics that actually predict protocol health and sustainable growth.
1. Wallet Rank — Quality Score, Not Just Quantity
Wallet Rank is ChainAware’s composite behavioral quality score for any wallet address, calculated from ten on-chain dimensions: experience level, risk willingness, protocol diversity, wallet age, balance history, AML status, transaction patterns, and more. Lower Wallet Rank number = higher quality (rank #500 is better than rank #15,000 — similar to a leaderboard).
For marketing analytics, the critical shift is measuring the distribution of Wallet Ranks among acquired wallets, not just the count. A campaign that connects 500 wallets with a median Wallet Rank of 3,000 is vastly more valuable than one that connects 3,000 wallets with a median Wallet Rank of 80,000 — because the first campaign reached experienced, high-quality DeFi participants with demonstrated protocol engagement history. Full methodology in our ChainAware Wallet Rank guide.
2. Behavioral Segments — DeFi Natives vs. NFT Collectors vs. Farmers
Not all DeFi participants are the same — and not all of them are the right target for every protocol. Behavioral segmentation using on-chain data distinguishes between: experienced DeFi power users (high Wallet Rank, multi-protocol engagement, long history), mid-tier engaged users (growing engagement, protocol focus developing), DeFi newcomers (recent wallets, limited history), and reward hunters (behavioral patterns matching airdrop farming). Each segment has a different expected LTV, different optimal acquisition cost, and different conversion message. For the complete segmentation framework, see our Web3 User Segmentation guide.
3. Churn Prediction — Will This User Return or Dump?
Behavioral AI can predict, at the time of wallet connection, the probability that a given wallet will remain an active user at 30, 60, and 90 days — based on patterns observed across millions of similar wallets in the behavioral database. A wallet with high predicted churn probability (based on behavioral signatures associated with short-term engagement and reward extraction) warrants minimal conversion investment. A wallet with low predicted churn probability (behavioral history showing sustained protocol engagement, long holding periods, and high risk willingness) justifies aggressive conversion spend. Churn prediction by wallet segment is a fundamentally different capability than the session-based cohort analysis that Web2 analytics provides.
4. Protocol Engagement Depth — One-Time vs. Power Users
Wallet connections and even first transactions say nothing about whether a user will become a power user — one of the high-frequency, high-LTV participants who generate the majority of protocol fees. Protocol engagement depth tracks the progression from wallet connection → first transaction → repeat engagement → cross-feature usage → long-term retention. On-chain data makes this progression measurable: you can track exactly how many transactions a cohort has executed, how many protocol features they’ve used, and how their engagement has trended over time. This longitudinal behavioral data is the foundation of realistic LTV calculation.
5. True CAC — Cost Per Quality User, Not Per Wallet Connection
Standard CAC (total marketing spend ÷ total wallet connections) is nearly meaningless as a Web3 performance metric because it treats all wallet connections equally. A useful CAC metric must be segmented: cost per power user acquisition, cost per mid-tier user acquisition, and — critically — the proportion of your current CAC that is being spent acquiring reward hunters with near-zero LTV.
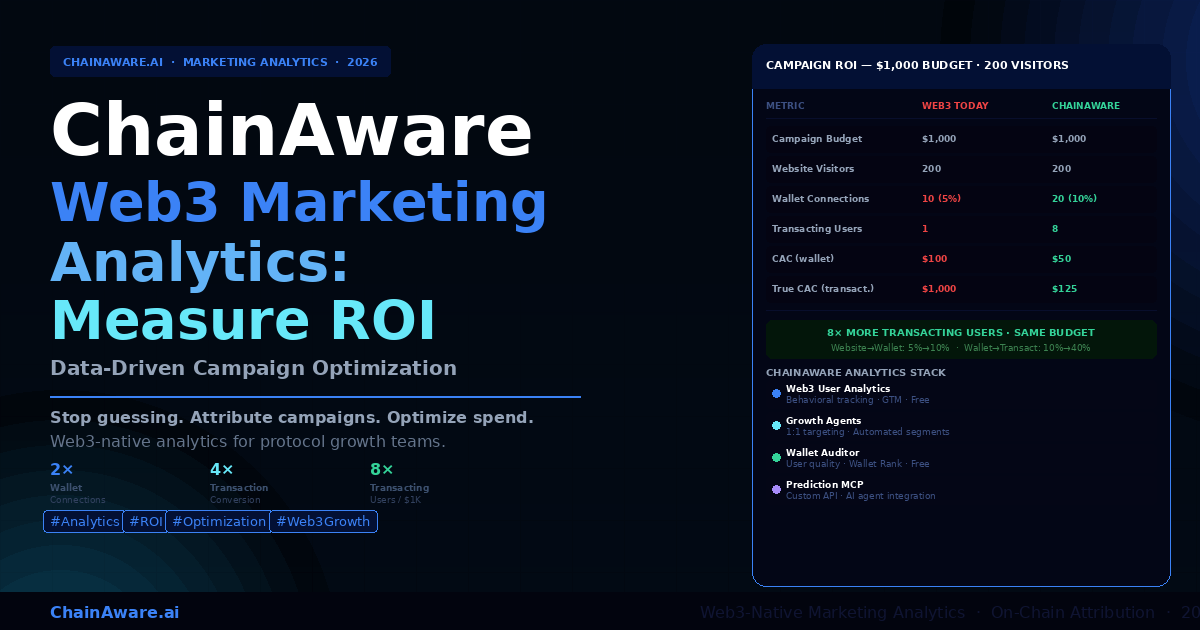
The difference between blended CAC and true transacting-user CAC is stark. Take a $1,000 campaign that brings 200 visitors to your Dapp. Without behavioral targeting, 5% connect their wallet (10 wallets) and 1 goes on to transact — giving a true CAC of $1,000 per transacting user. With ChainAware’s 1:1 targeting, the same 200 visitors produce 10% wallet connections (20 wallets) and 8 transacting users — a true CAC of $125 per transacting user. Same traffic, same budget, 8× the outcome.
How to Measure Campaign Effectiveness
With Web3-native analytics in place, measuring campaign effectiveness shifts from tracking clicks and sessions to tracking behavioral cohort quality over time. Here is the measurement framework that gives you meaningful, actionable campaign data.
Before/After Cohort Analysis
The most straightforward campaign measurement approach compares the behavioral quality profile of wallets acquired during a specific campaign period against baseline. Run Web3 Behavioral Analytics continuously, then define campaign windows and compare the wallet quality distribution within each window against the overall baseline. If a KOL campaign produces a visitor cohort where 60% show reward-hunter behavioral patterns compared to a baseline of 35%, that campaign is actively degrading your user base quality — regardless of how impressive the total wallet connection numbers look.
Cohort analysis by campaign type also reveals structural differences between acquisition channels. Organic content campaigns that attract users genuinely seeking information about your protocol typically produce higher Wallet Rank distributions than paid promotion campaigns. Community-driven referral programs often produce better behavioral quality than broad paid advertising. These differences only become visible when you measure behavioral quality by cohort rather than blending all acquisitions together.
Segment-Specific Conversion Rates
Overall conversion rate (wallets that connect and execute at least one meaningful transaction) hides critical segment-level differences. Track conversion rates separately for each behavioral segment: what percentage of power user wallets (Wallet Rank <5,000) convert to active users versus what percentage of newcomer wallets convert versus what percentage of wallets with reward-hunter profiles convert? These segment-specific conversion rates reveal both which campaigns are attracting convertible users and which product/onboarding experiences need improvement for specific segments.
Long-Term Retention Tracking (30/60/90 Day)
Retention at 30, 60, and 90 days after first transaction is the most reliable leading indicator of LTV for DeFi protocols. Track retention cohorts by: acquisition campaign, behavioral segment at acquisition time, and initial transaction type. A cohort with 70% 90-day retention is generating compounding protocol value. A cohort with 15% 90-day retention — however impressive its initial engagement metrics — is a churn factory that consumed acquisition budget to produce temporary TVL spikes.
On-chain data makes 90-day retention calculation straightforward: a wallet is “retained” if it has executed a qualifying transaction in the most recent period. This is more reliable than session-based retention in Web2 because on-chain activity is unambiguous — there is no distinction between “visited but didn’t engage” and “genuinely active.”
ROI Calculation: LTV vs. CAC by Segment
The ultimate campaign performance metric is segment-level ROI: LTV ÷ CAC for each behavioral segment, by acquisition campaign. This calculation requires combining three data sources: campaign spend and wallet acquisition counts by source (your attribution data), behavioral quality scores and predicted LTV by segment (from Web3 Analytics), and actual transaction fee generation by cohort over time (from on-chain data). When these three data sources combine, you get a genuine ROI picture that informs budget allocation: how much you spent per quality user acquired, what those users have generated in protocol fees, and whether the campaign was profitable on a per-segment basis.
Attribution in Anonymous Web3
Attribution — connecting marketing spend to specific user acquisitions — is the hardest measurement problem in Web3. The combination of wallet pseudonymity, multi-wallet users, and the disconnect between Web2 session data and Web3 on-chain activity creates genuine technical challenges. But meaningful attribution is achievable with the right architecture.
The Attribution Architecture
Web3 marketing attribution requires building a bridge between off-chain campaign data (UTM parameters, referral codes, Discord invite links, airdrop campaign tags) and on-chain wallet activity. The bridge is built at the moment of wallet connection — the one point where a browser session (carrying UTM data) meets a wallet address (carrying on-chain identity).
Attribution Data Flow: Campaign Source → UTM Parameters → Landing Page Session → Wallet Connection Event → UTM + Wallet Address (bridge point) → ChainAware Pixel → Behavioral Profile → Campaign Attribution + User Quality Score + LTV Prediction → Segment-Level Campaign ROI
UTM Parameters → Wallet Address Mapping
The practical implementation works as follows. Every campaign URL carries standard UTM parameters (utm_source, utm_medium, utm_campaign, utm_content). When a visitor arrives via a campaign link and connects their wallet, the ChainAware Pixel captures both the UTM parameters from the browser session and the wallet address from the connection event — recording them together in your analytics database. This creates a campaign-to-wallet mapping that persists indefinitely, allowing you to track the long-term on-chain behavior of every wallet acquired through every campaign.
The limitation of UTM-based attribution is the gap between campaign exposure and wallet connection. A user who clicks a Twitter ad, reads your documentation for three days, then connects their wallet will not have UTM parameters from the original ad — their UTM will reflect whatever their last session was. This is the Web3 version of the multi-touch attribution problem familiar from Web2 — and the same solutions apply: last-touch attribution for implementation simplicity, or multi-touch modeling for more sophisticated teams.
Campaign Tagging for Airdrops and Referrals
Airdrop campaigns require custom attribution architecture because the connection event is typically wallet-initiated (the user claims, rather than connecting through a campaign page). Effective airdrop attribution uses unique claim contract addresses or claim page variants per campaign — each claim page carries campaign-specific UTM data, so the UTM-to-wallet mapping is captured at claim time. Combined with behavioral quality screening at claim time (Wallet Rank gating to exclude farmers), this approach gives you both attribution data and user quality control in a single step.
Referral programs are actually the most attributable Web3 campaign type: a referral code is intrinsically linked to a specific referring wallet and a specific referred wallet, creating a permanent on-chain attribution record. Teams that run referral programs with on-chain code redemption have the clearest attribution picture of any Web3 acquisition channel — which is one reason referral programs consistently show the best quality-adjusted ROI in behavioral analytics data.
Multi-Touch Attribution Across Discord, Twitter, and Dapp
Most Web3 users interact with multiple channels before connecting their wallet for the first time. They might discover a protocol through a Twitter thread, ask questions in Discord, read the documentation, watch a YouTube explainer, see a friend’s activity in a Telegram group, and then finally connect their wallet two weeks later. Building a complete multi-touch attribution picture requires a consistent user identifier across all these touch points — which is technically challenging because pseudonymous Web3 users typically use different accounts (or no account) across different channels.
The practical approach for most teams is a combination of last-touch attribution (via UTM capture at wallet connection), community analytics (Discord and Telegram invite link tracking), and referral code attribution (for structured referral programs). According to Harvard Business Review’s research on multi-touch attribution, even imperfect attribution with 60–70% coverage produces significantly better budget allocation decisions than zero attribution — because it reveals the relative performance of different channels even if it misses some multi-touch paths. For how behavioral AI supports attribution and compliance simultaneously, see our guide on Predictive AI for Crypto KYC, AML and Transaction Monitoring.
ROI Calculation Framework
A rigorous Web3 marketing ROI framework has six components. Each builds on the previous, and together they transform marketing from a cost center into a measurable growth investment.
The Six-Component Web3 Marketing ROI Framework
1. Define success metrics beyond wallet connections. Set primary KPIs that capture quality, not just quantity: quality user acquisition rate (wallets with Wallet Rank <N that execute at least 2 transactions within 30 days), 90-day retention by cohort, and reward hunter rate. These replace raw wallet counts as your headline growth metrics.
2. Track cohort behavior over time. Every wallet connection is tagged with campaign source, date, and behavioral segment at connection time. Track each cohort’s on-chain activity at 7, 30, 60, and 90 days: transaction count, protocol feature usage, position size, and whether they are still active. This cohort data becomes your primary campaign performance signal.
3. Calculate true acquisition cost by segment. Divide campaign spend by the number of quality users acquired (not total wallets). If a $5,000 KOL campaign produced 1,200 wallet connections but only 180 passed quality thresholds, your true quality CAC is $27.78 — not the $4.17 that blended CAC would suggest. This per-segment CAC is the only number that enables meaningful channel comparison.
4. Measure LTV by behavioral segment. Track cumulative transaction fee generation for each cohort over 3, 6, and 12 months. Segment this LTV data by behavioral profile at acquisition: what is the 12-month LTV of a power user acquired through organic content vs. paid promotion? These LTV figures by segment are the denominator in your ROI calculation and the input to future budget allocation decisions.
5. Calculate segment-level ROI. ROI = (Segment LTV – Segment CAC) ÷ Segment CAC, calculated separately for each behavioral segment and each acquisition campaign. A campaign with a negative ROI for reward hunters but a 4× ROI for power users is a campaign worth running — just with farmer exclusion built in. A campaign with negative ROI across all segments should be stopped immediately regardless of how impressive its wallet connection numbers look.
6. Optimize spend allocation iteratively. Use segment-level ROI data to reallocate budget toward channels and campaign types with the highest quality-adjusted returns. Run this optimization cycle monthly — each cycle produces better data than the last, enabling progressive refinement of targeting, messaging, and channel mix. The compound improvement in efficiency over 3–6 cycles is typically 40–60% lower effective CAC for quality users.
Quality-Adjusted ROI = (Transacting Users × LTV per User) – Campaign Spend ÷ Campaign Spend
Example — $1,000 campaign, same 200 visitors: Without ChainAware: 1 transacting user × LTV – $1,000. With ChainAware: 8 transacting users × LTV – $1,000. True CAC without: $1,000/user. True CAC with: $125/user → 8× more efficient.
The $1,000 Campaign: Web3 Today vs. ChainAware
Rather than a hypothetical scenario, here is the actual funnel performance difference that ChainAware’s 1:1 behavioral targeting delivers — using the same $1,000 campaign budget, the same 200 website visitors, and the same Dapp.
The Funnel Comparison
| Metric | ❌ Web3 Today — Generic Campaigns | ✅ ChainAware — 1:1 Targeting |
|---|---|---|
| Campaign Budget | $1,000 | $1,000 |
| Website Visitors | 200 | 200 |
| Wallet Connections | 10 (5%) | 20 (10%) |
| Transacting Users | 1 | 8 |
| CAC (wallet) | $100 | $50 |
| True CAC (transacting) | $1,000 | $125 |
Where the 8× Improvement Comes From
The 8× improvement in transacting users is not a single lever — it is the product of two compounding conversion improvements driven by 1:1 behavioral targeting:
1. Website-to-wallet conversion: 5% → 10% (2× improvement). Without behavioral intelligence, a Dapp shows the same experience to every visitor — whether they are an experienced DeFi power user, a complete newcomer, or an airdrop farmer. The result is a generic experience that converts at the industry average of around 5%. With ChainAware’s 1:1 targeting, each visitor’s wallet history is read at the moment of arrival, and the experience is immediately tailored to their behavioral profile — the right message, the right incentive, the right product features surfaced for that specific user type. This alone doubles wallet connection rate.
2. Wallet-to-transaction conversion: 10% → 40% (4× improvement). Of wallets that connect without behavioral targeting, most never take a meaningful action — they connected out of mild curiosity, or were farming an anticipated airdrop, or weren’t shown anything relevant to their actual DeFi interests. With Growth Agents delivering segment-specific conversion sequences after connection — power users seeing protocol depth, newcomers seeing simplified onboarding, farmers excluded from incentive spend — the proportion of connected wallets that actually transact improves dramatically.
The compound effect: 2× at wallet connection × 4× at transaction conversion = 8× more transacting users from the same traffic and budget. According to McKinsey’s personalization ROI research, this compounding effect — where personalization improves multiple funnel stages simultaneously — is why behavioral targeting consistently outperforms single-stage optimization by a wide margin. The same principle applies in Web3: optimizing for both connection quality and post-connection conversion produces multiplicative, not additive, gains.
Tools & Implementation
The analytics and growth infrastructure described in this guide is available through ChainAware’s product suite. Here is how each tool contributes to the measurement and optimization framework.
ChainAware Web3 User Analytics — Behavioral Tracking
The foundation of Web3-native marketing measurement. Deploy via Google Tag Manager in under 30 minutes — no engineering changes, no smart contract modifications, no backend work. Once deployed, every wallet connection is profiled and aggregated in a 10-dimension dashboard showing experience levels, risk willingness, predicted intentions, Wallet Rank distribution, reward hunter rate, and protocol category engagement. This is the visibility layer that makes everything else possible. Complete setup guide: ChainAware Web3 Behavioral Analytics: Complete Guide.
Growth Agents — Automated Personalized Engagement
The conversion layer. Growth Agents use the behavioral profiles from Web3 Analytics to deliver personalized conversion experiences to each visitor segment automatically. Configure segment definitions, message variants, and conversion triggers — Growth Agents handle the orchestration. Segment-specific conversion rates are tracked in real time, giving you the measurement data to continuously refine messaging and targeting. No manual campaign management for individual user segments after initial setup.
Wallet Auditor — User Quality Assessment
The individual-wallet investigation tool. While Web3 Analytics provides aggregate behavioral data across your visitor base, the Wallet Auditor gives you the complete behavioral profile for any single wallet — useful for investigating specific high-value users, vetting KOL wallet credentials, auditing large-position users, or investigating anomalous behavior in your user base. See the Wallet Auditor complete guide for all use cases.
Transaction Monitoring Agent — Continuous Quality Control
The ongoing monitoring layer for platform-level user quality. While Web3 Analytics profiles wallets at connection, the Transaction Monitoring Agent rescores all active wallets continuously — alerting your team when a previously clean wallet’s behavioral profile deteriorates (fraud risk emerging, suspicious transaction patterns developing). For platforms where user quality directly affects protocol security and financial risk, continuous monitoring closes the gap between acquisition-time quality checks and long-term behavioral drift.
Prediction MCP — Custom Analytics Integration
For teams that want to integrate behavioral intelligence directly into custom analytics dashboards, BI tools, or data pipelines, the Prediction MCP provides programmatic API access to ChainAware’s full behavioral data layer. Query wallet profiles in real time from any system, build custom segment definitions, export cohort data for external analysis, or integrate with existing marketing attribution infrastructure. For a complete integration guide, see our Prediction MCP complete guide. For how AI-powered analytics applies to compliance and security alongside marketing, see AI-Powered Blockchain Analysis guide.
Implementation Timeline
Day 1: Deploy ChainAware Pixel via Google Tag Manager. Add the Pixel tag to your GTM container firing on wallet connection events. No code, no backend, no engineering ticket required. Live in 30 minutes.
Days 1–14: Baseline Behavioral Profiling. Let Analytics run for 2 weeks to build a baseline visitor behavioral profile. Understand your current mix: what % are power users, mid-tier, newcomers, reward hunters? This baseline is the before-state for all future campaign comparisons.
Week 2: Instrument All Campaign URLs with UTM Parameters. Tag every campaign URL with utm_source, utm_medium, utm_campaign. Ensure wallet connection events capture and store UTM data alongside the wallet address. Begin building your campaign-to-wallet attribution database.
Week 3: Configure Growth Agents for Key Segments. Set up at minimum two conversion flows: one for high-Wallet-Rank visitors (feature-depth messaging) and one for everyone else (simplified onboarding). Add reward-hunter suppression so incentive spend excludes low-quality wallets automatically.
Month 2: First Campaign Quality Comparison. Run your next campaign cycle with UTM attribution active. Compare the behavioral quality profile of this cohort against your baseline. Make one budget reallocation decision based on the data — move spend toward the channel with the best quality profile.
Month 3+: Iterative Optimization Loop. Each campaign cycle produces better attribution data, better segment profiles, and more cohort quality comparisons. Optimize budget allocation monthly based on quality-adjusted CAC. Track 90-day retention cohorts to validate that quality improvements are holding. Compound gains typically reach 25–40% efficiency improvement by month 6.
Frequently Asked Questions
Can I use Web3 Analytics alongside Google Analytics?
Yes — they are complementary, not competing tools. Google Analytics continues to track page-level traffic, session behavior, and content performance. ChainAware Web3 Analytics layers behavioral wallet profiling on top — tracking the quality and behavioral characteristics of wallets that connect, which GA cannot do. Both deploy via GTM and run simultaneously with no conflicts.
How does Wallet Rank gating work for airdrop campaigns?
You set a minimum Wallet Rank threshold for airdrop eligibility — for example, only wallets with Wallet Rank below 15,000 qualify. The claim process queries the ChainAware API at claim time and validates the claiming wallet against your threshold. Wallets that don’t meet the threshold see a message explaining the eligibility criteria. This eliminates farmer eligibility while preserving access for genuine DeFi participants with strong behavioral histories.
What’s a realistic timeline to see ROI improvement from behavioral analytics?
Most teams see measurable quality improvement in their first campaign cycle after deployment (typically 4–6 weeks). The first significant budget reallocation decision usually happens at 6–8 weeks when you have enough attributed cohort data to compare channel quality. Meaningful ROI improvement — 20–30% lower quality CAC — is typically visible at the 3-month mark. The 6-month point is when the compound improvement from iterative optimization becomes most dramatic.
What if my protocol is on a chain that ChainAware doesn’t cover?
ChainAware currently covers Ethereum, BNB Chain, Base, Polygon, Solana, TON, Tron, and Haqq — representing the chains where the vast majority of active DeFi users have significant on-chain history. For multi-chain protocols, wallet profiles are built from activity across all covered chains — so a user active on both Ethereum and Base has a richer behavioral profile than their activity on either chain alone would suggest.
How do I handle wallets that have no on-chain history?
Brand-new wallets with no on-chain history receive a minimal behavioral profile — which is itself meaningful signal. A wallet with no history that connects to your platform immediately after a major campaign launch is a strong indicator of a freshly created farming wallet. The absence of behavioral history is data: it suggests either a genuine newcomer (segment: onboard carefully with low spend) or a newly created farming wallet (segment: exclude from incentive programs).
Is this approach only for large protocols with big budgets?
The analytics layer (ChainAware Pixel + Web3 Behavioral Analytics) has a free tier and is designed to be valuable at any scale. In fact, smaller protocols benefit disproportionately — a $5,000/month marketing budget with 70% farmer acquisition is a critical problem when you have limited runway. Knowing that your airdrop is predominantly farming wallets and restructuring it costs nothing to diagnose but saves thousands per month in misallocated spend. Behavioral analytics ROI is actually highest for protocols where marketing efficiency is a survival question, not a growth optimization.