You launched a marketing campaign. Traffic spiked. Wallet connections went up. But transactions didn’t follow. Why?
Without behavioral data on who is actually connecting their wallet to your platform, you cannot answer that question. You’re optimizing in the dark — adjusting spend, changing creatives, testing new channels — without knowing whether the fundamental problem is campaign targeting, product-market fit, user experience, or the simple fact that you’re attracting the wrong users entirely.
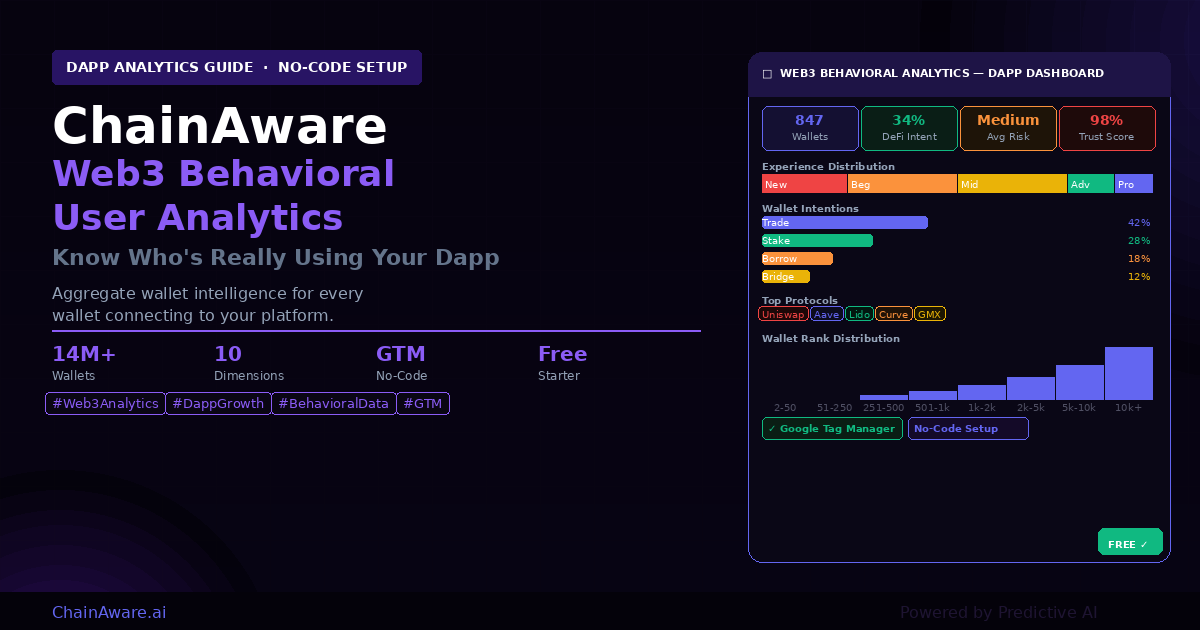
ChainAware Web3 Behavioral User Analytics solves this. It is the first analytics platform built specifically for Dapp teams that aggregates the behavioral intelligence of every connecting wallet — revealing the real intentions, experience levels, risk profiles, and quality of your users from day one.
Setup takes minutes via Google Tag Manager. No code changes. No engineering sprint. And the starter plan is free.
In This Guide
- What Is Web3 Behavioral User Analytics?
- How It Works: From Wallet Connection to Dashboard
- The 8 Dashboard Dimensions Explained
- Why Behavioral Analytics — 5 Problems It Solves
- The Baseline Principle: You Can’t Optimize What You Can’t Measure
- Real-World Use Cases for Dapp Teams
- How to Set Up: Google Tag Manager Integration
- Behavioral Analytics vs. Token Rank: Same Dashboard, Different Lens
- How It Fits the ChainAware Ecosystem
- FAQ
What Is Web3 Behavioral User Analytics?
Web3 Behavioral User Analytics is the aggregate layer of ChainAware.ai’s Web3 Predictive Data Layer. Here’s the simplest way to understand the relationship:
- The Wallet Auditor analyzes one wallet — generating a complete behavioral profile covering risk willingness, experience, intentions, AML status, protocol history, and Wallet Rank.
- Web3 Behavioral User Analytics aggregates the Wallet Audit of every wallet that connects to your Dapp — turning thousands of individual profiles into a single, actionable dashboard that shows you who your users collectively are.
Think of it as Google Analytics for Web3 behavioral intelligence. Where Google Analytics tells you how many users visited, which pages they viewed, and where they came from — Behavioral Analytics tells you who those users are at a behavioral level: their Web3 experience, their financial risk tolerance, their likely next on-chain actions, and their overall wallet quality.
This is data that has never existed before in any form. There is no Web2 equivalent. Pseudonymous wallet addresses don’t come with demographic forms or preference questionnaires. The Wallet Auditor derives behavioral intelligence directly from verifiable on-chain history — and Behavioral Analytics makes that intelligence available at the Dapp-wide aggregate level, in a dashboard your whole team can read.
Try the live demo (built on real client data): chainaware.ai/enterprise/pixel?demo=true
How It Works: From Wallet Connection to Dashboard
The data pipeline is straightforward and fully automated once the pixel is installed:
- A user visits your Dapp and connects their wallet — the ChainAware pixel, installed via Google Tag Manager, captures the wallet address at the moment of connection.
- The Wallet Auditor API runs a full behavioral profile — ChainAware.ai’s engine queries its 14M+ wallet database and generates a complete Wallet Audit for that address: risk willingness, experience level, risk capability, predicted trust, intentions, transaction categories, protocol usage, AML analysis, wallet age, and Wallet Rank.
- The profile is added to your Dapp’s aggregate dataset — each new wallet connection enriches the cumulative behavioral picture of your user base.
- The dashboard updates once per day — like Google Analytics, the aggregate views refresh daily. Your team logs in and sees the updated behavioral profile of your entire user base, including any new wallets that connected in the previous 24 hours.
- You act on the insights — adjust campaigns, refine targeting, optimize product positioning, identify mismatches between your users and your product, and establish baselines for measuring future campaign impact.
The entire flow requires zero code changes to your Dapp. If you already use Google Tag Manager (and most modern Dapps do), adding the ChainAware pixel is a configuration task, not an engineering task. If you want to disable data collection at any point — for any reason — simply disable the ChainAware tag in your Google Tag Manager. Done.
We recommend pairing ChainAware with Google Analytics in the same Google Tag Manager container: GA4 for traffic, session, and conversion data; ChainAware for the behavioral and on-chain intelligence layer that GA4 simply cannot provide for Web3 audiences.
The 8 Dashboard Dimensions Explained
The Behavioral Analytics dashboard shows eight aggregate dimensions across your Dapp’s user base. Each one answers a specific, actionable question that no other analytics tool can answer for Web3 platforms.
1. Wallet Intentions
The question it answers: What are your users actually trying to do?
Intentions shows the aggregate distribution of predicted next actions across your user base: what percentage are likely to trade, stake, borrow, bridge, buy NFTs, or take other specific on-chain actions in the near term. This is derived from each wallet’s recent behavioral trajectory — the direction of its on-chain activity — not just its historical categories.
Why it matters in practice: If you run a lending protocol and your Intentions dashboard shows that 65% of your connecting wallets have high trading intent and only 12% have borrowing intent, your marketing is attracting the wrong users. The product-audience mismatch is visible immediately, before you’ve wasted another month of campaign budget.
2. Experience Distribution
The question it answers: How sophisticated are your users?
Experience Distribution shows the breakdown of your user base from Web3 newcomers (Experience Level 1) through to veteran DeFi participants (Experience Level 5). This is a direct measure of how Web3-native your audience is — derived from each wallet’s protocol history, transaction complexity, and time-in-ecosystem.
Why it matters in practice: If you’re running a complex DeFi product and your Experience Distribution shows 60% of users are at Level 1-2, your onboarding and educational content is failing — or your acquisition channels are reaching the wrong audience. Conversely, if you’re a beginner-focused product and your users are predominantly Level 4-5, you may be under-serving your actual target market.
3. Risk Willingness
The question it answers: How risk-tolerant is your user base?
Risk Willingness shows the aggregate psychometric risk profile of your users — the distribution from highly conservative to highly aggressive, derived from each wallet’s on-chain behavioral history. This is the same parameter that behavioral finance researchers spend millions measuring through surveys and questionnaires. Behavioral Analytics provides it from on-chain data, automatically.
Why it matters in practice: For a leveraged yield protocol, a predominantly low-risk-willingness user base is a conversion problem waiting to happen. For a capital-preservation product, it’s perfect alignment. Knowing your users’ collective risk profile is foundational to product positioning, messaging, and feature prioritization. According to CFA Institute’s research on behavioral risk profiling, risk tolerance is the single most important variable in predicting financial product adoption — and it’s now measurable for your entire Dapp user base at no cost.
4. Protocol Categories Used
The question it answers: What types of on-chain activity do your users come from?
This dimension shows the distribution of your users’ prior on-chain activity across protocol categories: DeFi lending, DEX trading, NFT activity, GameFi, bridging, staking, governance, and more. It reveals the ecosystem context your users are coming from — their Web3 “home ground.”
Why it matters in practice: If your Dapp is a DeFi lending protocol but your Protocol Categories dashboard shows that 70% of users are primarily NFT participants with minimal DeFi history, you face a specific education and onboarding challenge. Your users know Web3 but don’t know your protocol’s category. That’s a very different problem to solve than if they come from competing DeFi protocols.
5. Top Protocols Used
The question it answers: Which specific protocols have your users come from?
Beyond categories, Top Protocols shows the specific protocols most commonly appearing in your users’ histories — Uniswap, Aave, Compound, Lido, GMX, OpenSea, and so on. This is competitive intelligence of the most direct kind: a map of where your users have been before they found you.
Why it matters in practice: If Aave appears in 40% of your users’ protocol histories, your users understand overcollateralized lending — you can communicate at that level without educating the basics. If you’re building a competing lending product, you know exactly who you’re competing for and what language they speak.
6. Predicted Fraud Probabilities
The question it answers: What is the aggregate trust quality of your user base?
This dimension shows the distribution of Predicted Trust scores across your connecting wallets — the proportion of your users who score as high-trust, watchlist, or high-risk according to ChainAware.ai’s fraud detection model (98% accuracy on Ethereum). It gives you an immediate read on whether bot activity, airdrop farming, or suspicious wallets are distorting your engagement metrics.
Why it matters in practice: If a campaign drives a sudden spike in wallet connections but Predicted Fraud Probabilities shows a corresponding spike in low-trust wallets, you know the campaign attracted bots or farmers rather than genuine users. Your conversion metrics are being gamed — and without this data, you’d never know why genuine conversions didn’t follow.
7. Wallet Rank Distribution
The question it answers: What is the overall quality of your user base?
Wallet Rank Distribution shows how your users are distributed across the quality spectrum — from top-percentile wallets (low Wallet Rank numbers) through to newcomer or low-quality addresses (high Wallet Rank numbers). This is the most comprehensive single-view summary of your user base quality. For a deep explanation of what Wallet Rank measures, see our complete Wallet Rank guide.
Why it matters in practice: A platform whose Wallet Rank Distribution skews heavily toward high-quality wallets is attracting experienced, trusted, economically capable Web3 participants — the users most likely to transact, return, and contribute to long-term platform TVL and activity. A distribution skewed toward low-quality wallets signals that despite traffic, the platform has a user quality problem.
8. Wallet Age Distribution
The question it answers: How long have your users been in Web3?
Wallet Age Distribution shows the breakdown of your users by how long their wallets have been active — from wallets created in the last month through to wallets with multi-year histories. This is one of the cleanest signals of whether you’re attracting veterans or newcomers.
Why it matters in practice: A platform that sees a surge in connections from wallets created in the last 30 days is almost certainly seeing airdrop farming or sybil activity. A platform whose users predominantly have 2+ year wallet histories is attracting genuine, committed Web3 participants. The distribution tells you which story is true.
Why Behavioral Analytics — 5 Problems It Solves
These are the five most common situations where Dapp teams discover they need behavioral analytics — usually after they’ve already spent budget trying to solve the problem without it.
Problem 1: High Wallet Connections, Zero Transactions
You run a campaign. Traffic is up. Wallet connections are up. But nobody is transacting. Your team debates endlessly: is it the product? The UI? The messaging? The fees?
Behavioral Analytics gives you the answer. Check the Intentions dashboard: are the connecting wallets even predisposed to do what your protocol requires? Check the Experience Distribution: do they have the knowledge to navigate your product? Check Predicted Fraud Probabilities: is a significant portion of those connections bots or farmers who will never transact regardless of how good your product is?
Without this data, the debate is speculation. With it, you have a diagnosis.
Problem 2: Campaign Brings the Wrong Users
You run a lending protocol. You invest in a DeFi-focused campaign. But your Protocol Categories dashboard shows that the new users coming in are predominantly NFT and GameFi participants with minimal lending history. Your campaign found DeFi-adjacent users, not DeFi lending users.
Or: you’re a borrow/lend platform and your Intentions dashboard shows the majority of new users have high trading intent. Traders are landing on a lending product they weren’t looking for. Conversion will be structurally poor regardless of how well the product works — because the audience-product match isn’t there.
Behavioral Analytics makes this mismatch visible before you’ve burned through your campaign budget on users who were never going to convert.
Problem 3: Complex Product, Beginner Users
Your product requires meaningful DeFi literacy — understanding collateral, liquidation risk, yield mechanics. But your Experience Distribution shows that 55% of users connecting are at Level 1-2. They’re discovering your product through social media or influencer promotion, connecting their wallet, and then bouncing — because the product assumes knowledge they don’t have.
This isn’t a product problem — it’s a targeting problem. The right users for your product are out there. Behavioral Analytics tells you that your current channels are not reaching them.
Problem 4: Loyalty Program Participants Who Never Transact
You’ve built a points or loyalty mechanic. Users connect wallets to earn points. Engagement metrics look decent. But actual protocol usage — the transactions that generate revenue and TVL — remains flat.
Behavioral Analytics reveals the profile of your loyalty participants: are they experienced DeFi users who are genuinely exploring your protocol before committing? Or are they predominantly airdrop farmers (low Wallet Age, high volume of recent connections from new wallets, low Predicted Trust scores) who are gaming the points system with no intention of ever transacting?
These are completely different problems requiring completely different responses. Behavioral Analytics tells you which one you have.
Problem 5: Marketing Spend with No Measurable Impact
You invest in influencer campaigns, Twitter/X promotions, Discord community building, and conference sponsorships. Wallet connections fluctuate. But you have no way to determine whether any specific campaign improved the quality of users arriving — or just added noise.
Behavioral Analytics establishes a quality baseline. Before a campaign, your Wallet Rank Distribution and Experience Distribution define your typical user profile. After a campaign, you compare: did the new connections improve or degrade the overall quality metrics? A campaign that drives 500 new connections of predominantly Level 1, low-Wallet-Rank users is less valuable than one that drives 100 new connections of Level 4-5, high-Wallet-Rank users — even though the headline number looks worse. According to Harvard Business Review’s research on behavioral data in marketing, teams that measure behavioral quality alongside volume metrics make significantly better campaign allocation decisions.
The Baseline Principle: You Can’t Optimize What You Can’t Measure
This is the foundational insight behind Behavioral Analytics, and it’s worth stating explicitly because it’s so often overlooked in Web3 marketing.
In Web2, you can measure almost everything: click-through rates, conversion funnels, cohort retention, LTV by acquisition channel, A/B test results at every step. The result is a mature optimization culture where marketing decisions are grounded in data.
In Web3, this infrastructure is mostly absent. Wallet addresses are pseudonymous — they don’t attach to user profiles. Transaction data is public but raw — it tells you what happened, not who did it or why. Most Dapp teams are flying blind on user quality, making acquisition decisions based on the same easily-manipulated vanity metrics that Token Rank was designed to expose as unreliable.
Behavioral Analytics is the infrastructure that makes Web3 marketing measurable. Specifically, it enables three things that were previously impossible:
- Baseline establishment: Before any campaign, you have a documented behavioral profile of your typical user. This is your “before” state — the benchmark against which every future campaign is measured.
- Campaign quality scoring: After any campaign, you measure whether the new users improved or degraded the baseline across all eight dimensions. Volume is one metric; quality is another. You need both.
- Cohort comparison: Over time, you can compare user quality across different acquisition periods, channels, and campaign types — identifying which sources consistently deliver high-quality users and which deliver noise.
According to Gartner’s research on data-driven marketing, organizations that establish behavioral baselines and measure campaign quality — rather than just volume — achieve 2-3x better unit economics on their marketing investment. In DeFi, where user acquisition costs are high and low-quality users generate near-zero LTV, this efficiency gap is existential.
Real-World Use Cases for Dapp Teams
DeFi Protocol: Optimizing for Transacting Users, Not Just Connected Wallets
A DeFi lending protocol integrates Behavioral Analytics and immediately discovers that while 800 wallets connect per week, only 12% have borrowing intent in their Intentions profile. The majority are traders — attracted by the protocol’s brand presence in DeFi social channels, but not looking for lending products.
The team adjusts campaign targeting to focus specifically on channels frequented by borrowing-intent wallets: communities around collateral assets, stablecoin yield optimization forums, and DeFi users actively discussing capital efficiency. Within four weeks, the intention match rate improves from 12% to 31% — and conversion-to-transaction rates follow. See how this approach drove measurable results in the SmartCredit.io case study: 8x engagement, 2x conversions.
GameFi Platform: Distinguishing Genuine Players from Airdrop Farmers
A GameFi platform launches a wallet-connection incentive campaign. Wallet connections spike 400% over two weeks. The team is elated — until Behavioral Analytics shows that 73% of the new connections are wallets created within the last 30 days, with Predicted Fraud Probabilities skewing heavily toward the low-trust range. The connections are predominantly airdrop farmers, not genuine players.
The team uses this insight to implement a Wallet Rank threshold for incentive eligibility — requiring a minimum Wallet Age and Wallet Rank to qualify. Farmers are effectively excluded. The incentive campaign continues, but now rewards genuine users disproportionately. Player retention improves markedly because the reward pool is no longer being diluted by non-players.
NFT Marketplace: Identifying High-Value Collector Segments
An NFT marketplace uses Behavioral Analytics to profile its user base and discovers a specific segment: wallets with 3+ years of history, high NFT transaction category share, and top-quintile Wallet Ranks. These are experienced collectors — the users most likely to make repeated high-value purchases. They represent only 18% of wallet connections but account for a disproportionate share of actual transaction volume.
The team designs a VIP-tier experience specifically for this segment — early access to new collections, curator relationships, and reduced fees. By identifying and nurturing the high-quality segment that behavioral analytics revealed, they build a retention flywheel that significantly improves platform LTV. For how to personalize at this level automatically, see our guide on why personalization is the next big thing for AI agents in Web3.
DeFi Protocol: Validating Campaign ROI Across Channels
A DeFi protocol runs simultaneous campaigns across three channels: Twitter/X promotion, KOL partnerships, and targeted Discord outreach in DeFi communities. Behavioral Analytics gives the team a way to measure not just which campaign drove more connections, but which drove better connections.
The results are surprising: the KOL campaign drives the highest volume but the worst Wallet Rank and Experience distributions — predominantly newcomer wallets with low engagement quality. The Discord outreach campaign drives the lowest volume but the best behavioral quality — highly experienced wallets with strong borrowing intent and high Wallet Ranks. The team reallocates budget accordingly. For the broader framework of how behavioral data powers DeFi growth, see 5 ways Prediction MCP turbocharges DeFi platforms.
How to Set Up: Google Tag Manager Integration
The entire integration process requires no engineering involvement if you already use Google Tag Manager. Here is the step-by-step:
Step 1: Subscribe at the Free Starter Plan
Go to chainaware.ai/subscribe/starter and subscribe to the free starter plan. You’ll receive your unique ChainAware pixel code and access to your analytics dashboard.
Step 2: (Optional) Schedule a Free Consulting Call
ChainAware.ai offers a free onboarding consulting call to help you configure your integration correctly, interpret your first dashboard results, and plan your analytics strategy. This is optional but recommended for teams new to behavioral analytics.
Step 3: Add ChainAware Pixel to Google Tag Manager
Open your Google Tag Manager container. Create a new Custom HTML tag with your ChainAware pixel code. Set the trigger to fire on wallet connection events (or all pages if you want to capture wallet connection events from any page visit). Publish the container. That’s it — no code changes to your Dapp required.
We recommend organizing your GTM container to keep analytics tags together: GA4, ChainAware, and any other analytics tools in a single logical group. This makes it easy to manage, audit, and — if needed — disable specific tags independently.
Step 4: Verify Data Collection
Connect a test wallet to your Dapp. Within 24 hours, the wallet’s behavioral profile should appear in your dashboard aggregate data. If you want to verify immediately, use the free Wallet Auditor to check the profile of your test wallet — the same data should appear in your aggregate dashboard in the next daily refresh.
Step 5: Read Your First Dashboard
After a week of data collection, your dashboard will show meaningful aggregate patterns across all eight dimensions. This is your baseline. Document it — this is the behavioral profile of your users as of today, before any optimization work begins.
Disabling Data Collection
If you want to stop collecting data at any point — for privacy reasons, GDPR compliance, or any other reason — simply disable the ChainAware tag in Google Tag Manager and publish the container update. Data collection stops immediately. No code changes required.
According to Salesforce research on customer data platforms, organizations that use behavioral data to inform marketing decisions consistently outperform those relying on demographic or traffic data alone. The Google Tag Manager integration makes this capability accessible to every Dapp team regardless of engineering resources.
Behavioral Analytics vs. Token Rank: Same Dashboard, Different Lens
Web3 Behavioral User Analytics and Token Rank share the same dashboard infrastructure and the same eight dimensions — but they analyze different audiences with different purposes.
| Dimension | Behavioral Analytics | Token Rank |
|---|---|---|
| Audience | Wallets connecting to your Dapp | Wallets holding your token |
| Primary use | Campaign optimization, user quality | Investment due diligence, holder quality |
| Data source | ChainAware pixel via GTM | Token holder list from chain |
| Who benefits | Dapp teams, growth marketers | Investors, protocols, exchanges |
For Dapp teams that also have a token, running both tools gives you the most complete picture: Behavioral Analytics tells you about your platform users; Token Rank tells you about your token holders. The two audiences often overlap but are rarely identical — and understanding both is essential for a complete growth strategy. See the full guide to how Token Rank works and how to use it.
How It Fits the ChainAware Ecosystem
Behavioral Analytics is one layer of ChainAware.ai’s connected Web3 intelligence suite. Understanding how the tools relate helps you build a complete platform strategy:
- Wallet Auditor — analyze any single wallet in 30 seconds. Free. The atomic unit of the entire system. Full guide: Wallet Auditor complete guide.
- Web3 Behavioral Analytics (this guide) — aggregate the Wallet Audit of every user connecting to your Dapp. Free starter plan via GTM.
- Token Rank — aggregate the Wallet Rank of every holder of a token. Free. Investor-facing due diligence tool.
- Growth Agents — automatically personalize in-app content for each connecting wallet based on their individual behavioral profile. The per-user application of the behavioral intelligence that Analytics shows in aggregate.
- Behavioral Prediction MCP — expose the full Wallet Audit as a real-time API endpoint for AI agents and LLMs. For developers who want to build personalized interactions programmatically. Full guide: Prediction MCP developer guide.
The typical adoption path for a Dapp team: start with Behavioral Analytics to understand your user base in aggregate → use Wallet Auditor to investigate specific users or segments → deploy Growth Agents to personalize at the individual level → integrate Prediction MCP for full programmatic control. Each step builds on the insight from the previous one.
Frequently Asked Questions
Is Web3 Behavioral Analytics really free?
Yes — the starter plan at chainaware.ai/subscribe/starter is free. Enterprise plans with higher data volumes, custom integrations, and dedicated support are available for larger platforms.
Does it require changes to my Dapp’s code?
No. Integration is entirely via Google Tag Manager. If you already have GTM on your Dapp, the only step is adding the ChainAware pixel as a new tag and publishing. No code changes to your Dapp’s codebase.
How is this different from Google Analytics or Mixpanel?
GA4 and Mixpanel track behavioral events: page views, clicks, session durations, conversion funnels. They tell you what users do on your platform. Behavioral Analytics tells you who those users are at a Web3 behavioral level — their DeFi experience, risk tolerance, on-chain history, and predicted next actions. They are complementary, not competing. We recommend running both in the same GTM container.
What data privacy considerations apply?
All data processed by Behavioral Analytics is derived from public on-chain transaction data — no personal information is collected or stored. Wallet addresses are pseudonymous by nature. ChainAware.ai processes only the wallet address captured at connection and the corresponding public on-chain data. If you want to stop data collection, disable the GTM tag.
How many wallets need to connect before the dashboard is meaningful?
Aggregate patterns become statistically meaningful at around 50-100 wallet connections. For smaller platforms in early growth, the Wallet Auditor can be used to audit individual users manually while the aggregate dataset builds up.
Can I compare behavioral profiles across different time periods?
Yes — the dashboard supports time-range selection, allowing you to compare the behavioral profile of users who connected during a specific campaign period against your baseline. This is the core workflow for measuring campaign quality over time.