
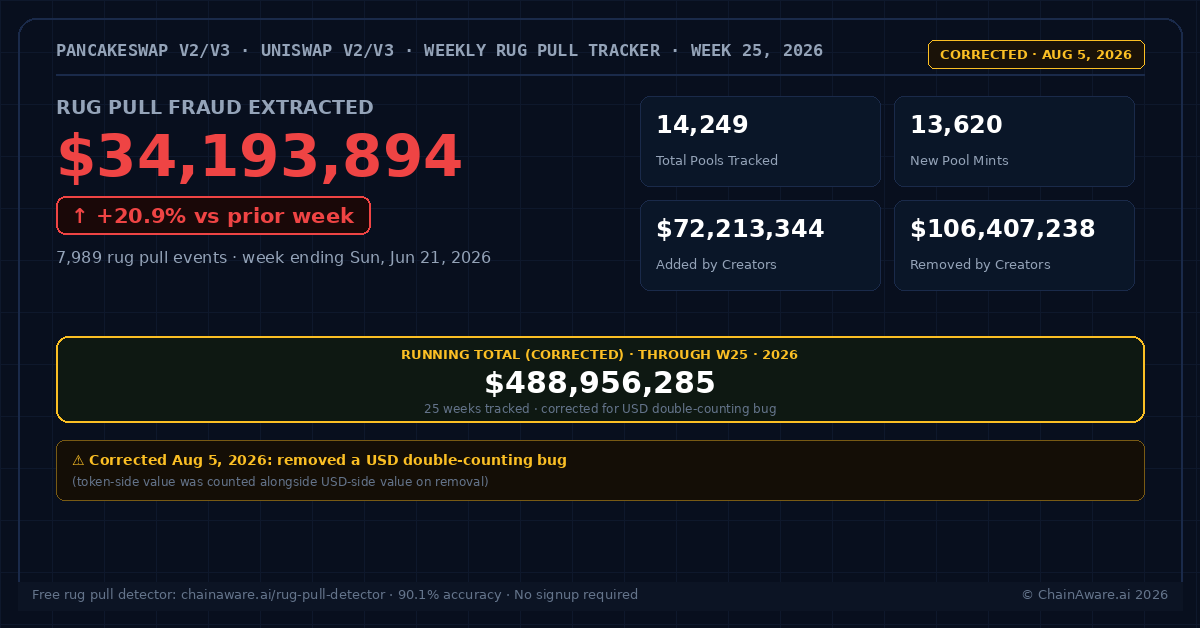
$64.4M Extracted in Week 25 – Reacceleration Confirms New Baseline, Total Crosses $800M


Week 25 delivered $64,404,228 in rug pull extraction across PancakeSwap V2, PancakeSwap V3, Uniswap V2, and Uniswap V3 – up 18.9% from Week 24’s $54,181,856, and the second-highest weekly fraud value in the 25-week dataset. Rather than continuing to decay toward the W21-W22 plateau, extraction reaccelerated. The running 25-week total now stands at $822,350,515 – crossing the $800M milestone.

Rug pull events declined slightly to 10,274, down 8.0% from W24’s record 11,164 – but this remains the third-highest weekly event count in the dataset, behind only W23 and W24. Three consecutive weeks above 10,000 rug pull events confirms this is not a single-week anomaly. It is a sustained higher-intensity phase.

This Week’s Numbers – Week 25, 2026 · PancakeSwap V2/V3 + Uniswap V2/V3

$64,404,228
Rug Pull Fraud
+18.9% vs W24 – reaccelerated
10,274
Rug Pull Events
-8.0% vs W24 – still 3rd highest on record
10,877
Total Pools Created
10,274 with active liquidity
$139,882,797
Liquidity Added by Creators
The bait – seeded to attract retail buyers
$204,287,025
Liquidity Removed by Creators
The exit – retail capital extracted

Three Weeks Above $54M: A New Baseline, Not a Spike

W23, W24, and W25 are now the three highest-value weeks in the dataset other than each other. With W25 reaccelerating rather than continuing the post-peak pullback seen in W24, the evidence increasingly points away from “spike and revert” and toward a structural step-change in extraction intensity. The removed-to-added liquidity ratio climbed back to 1.46x in W25, up from 1.40x in W24 – nearly matching the W23 peak ratio of 1.45x.

Week Pools Rug Events Added Removed Fraud Value WoW
2026-W2111,3716,870$69.8M$102.3M$32,422,973-15.6%
2026-W2211,3006,557$68.3M$100.7M$32,459,995+0.1%
2026-W2311,69310,955$154.4M$223.3M$68,937,024+112.4%
2026-W2411,79011,164$134.4M$188.6M$54,181,856-21.4%
2026-W2510,87710,274$139.9M$204.3M$64,404,228+18.9%

Reading the Reacceleration

Pool creation eased to 10,877 in W25, down from W24’s 11,790 – the lowest pool count since W22. Fewer new pools, fewer rug events, but higher fraud value and a higher extraction ratio. This combination points to a smaller number of operators running larger, more efficient extractions rather than a broad wave of low-value schemes. It is the inverse signature of W21, where event volume surged while value per rug fell – and a reminder that the rug pull industry shifts between volume-driven and value-driven phases depending on which operator cohort is most active in a given week.

The 5-week trailing average (W21-W25) now stands at approximately $50.5M – confirming that the post-W23 elevated baseline has held for a third consecutive week rather than reverting. The 25-week mean has risen to approximately $32.9M, pulled upward by three consecutive high-extraction weeks. For the full methodology and the original 20-week dataset that trained Rug Pull Detector V3, see our $569M PancakeSwap V2 analysis.

RUG PULL DETECTOR V3 – FREE
Check Any Pool Before You Invest – 90.1% Accuracy
Behavioral analysis of contract creators + smart contract code inspection. Handles pools and individual tokens. No signup required. For businesses, subscribe to the API. For AI agents, X402 protocol is enabled.
→ Run a Free Check at chainaware.ai/rugpull ↗

25-Week Running Total: $822.4M

Week 25 pushes the cumulative total past the $800M milestone – $822,350,515 extracted from retail investors across PancakeSwap V2, PancakeSwap V3, Uniswap V2, and Uniswap V3 in the first 25 weeks of 2026, just under halfway through the year.

Metric W1-W25 Total
Total rug pull events141,007
Net retail losses$822,350,515
Average weekly extraction~$32.9M
5-week trailing avg (W21-W25)~$50.5M
Peak weekW23 – $68,937,024
Highest rug event weekW24 – 11,164 events

Halfway through 2026, retail investors have lost $822.4M to confirmed liquidity-extraction rug pulls across PancakeSwap V2, PancakeSwap V3, Uniswap V2, and Uniswap V3 alone – excluding LP token transfer schemes, unlocked token sell-offs, honeypots, and associated wallet extraction. At the current 25-week average of $32.9M per week, the full-year run rate projects to approximately $1.71 billion if the pattern of recent weeks persists. The three-week reacceleration in W23-W25 is the single largest contributor to that upward revision since the dataset began.

How to Protect Yourself

With three consecutive weeks above 10,000 rug pull events and extraction value reaccelerating rather than reverting, the current environment across PancakeSwap and Uniswap V2/V3 represents the highest-risk sustained period in the dataset’s history. ChainAware’s free tools screen any pool or token in under two minutes:

  • Rug Pull Detector V3 – behavioral analysis of the contract creator + smart contract code inspection. 90.1% prediction accuracy. Free, no signup.
  • Fraud Detector – full behavioral history of any deployer wallet. 98% fraud prediction accuracy.
  • Wallet Auditor – for P2P transactions. Complete behavioral profile of any receiving wallet before sending funds.
NEXT WEEK
Week 26 Data Published Every Monday
ChainAware publishes fresh rug pull data every week across PancakeSwap V2, PancakeSwap V3, Uniswap V2, and Uniswap V3 – pool creation, rug events, fraud value, and week-over-week analysis. Follow the archive for every weekly update.
→ Follow the Rug Pull News archive ↗

About This Tracker

The ChainAware Weekly Rug Pull Tracker measures the most basic, mathematically verifiable form of rug pull across PancakeSwap V2, PancakeSwap V3, Uniswap V2, and Uniswap V3: a contract creator adds liquidity (Mint event), retail investors buy in, and the creator removes more than they added (Burn event). The difference is confirmed retail loss. This definition is conservative – it excludes LP token transfer rug pulls, unlocked token sell-offs, honeypot contracts, and associated wallet extraction. Numbers reported here represent the confirmed floor. For complete methodology, see chainaware.ai/resources/rugpull-verification ↗.