
CORRECTED August 5, 2026
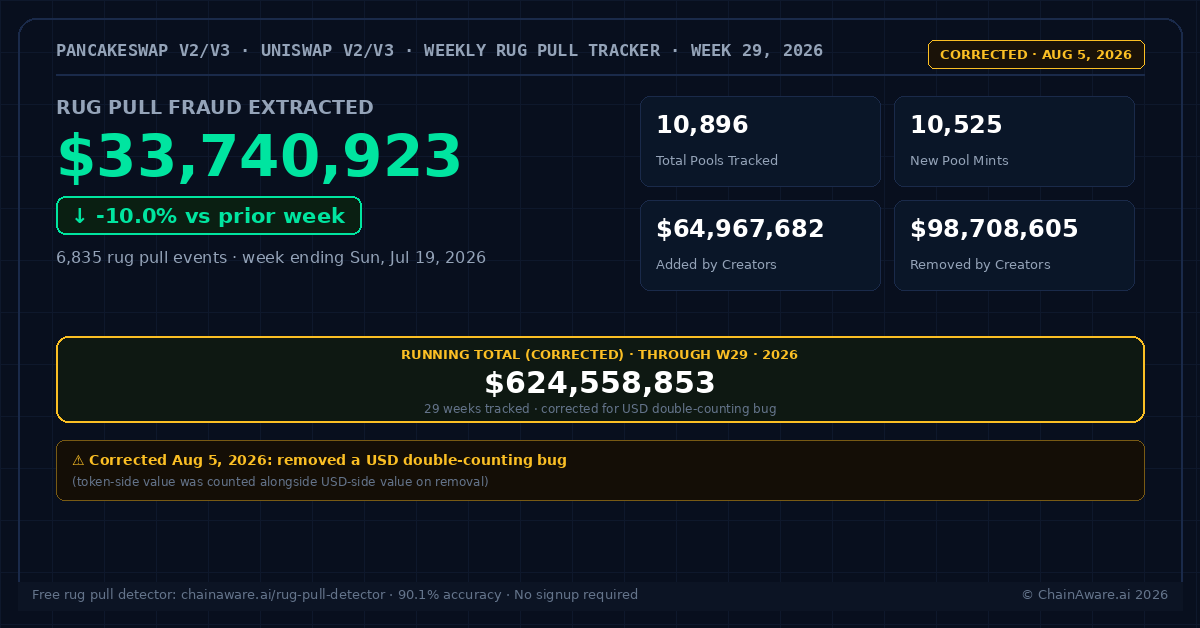
This article was corrected to fix a USD double-counting bug: the original calculation counted both the USD-value and the token-value of a creator’s liquidity removal, even though the rugged token’s value is effectively $0 after the rug. Corrected figures below reflect USD-side value only. Corrected figures are meaningfully lower than the original publication.
Data covers PancakeSwap V2, PancakeSwap V3, Uniswap V2, and Uniswap V3. Week 29 = week ending Sunday, July 19, 2026.
Week 29 saw $33,740,923 extracted from retail investors across PancakeSwap V2, PancakeSwap V3, Uniswap V2, and Uniswap V3 – declined 10.0% from the prior week’s $37,486,843. 6,835 confirmed rug pull events were recorded this week. The running total since tracking began now stands at $624,558,853.
Week 29 Key Numbers
Week 29 Analysis
The removed-to-added liquidity ratio stands at 1.519x this week – creators removed $1.52 for every $1.00 they seeded. Average extraction per rug event was $4,936 this week. The rug-to-mint ratio was 64.9% – roughly 6 in every 10 newly minted pools ended in a liquidity extraction event.
Week-on-Week Comparison
| Week | Fraud Extracted | Rug Events | Total Pools | New Mints | Added | Removed | Ratio |
|---|---|---|---|---|---|---|---|
| W27 | $32,272,069 | 8,205 | 14,400 | 13,901 | $69,049,681 | $101,321,750 | 1.467x |
| W28 | $37,486,843 | 8,343 | 14,271 | 13,427 | $73,764,067 | $111,250,910 | 1.508x |
| W29 | $33,740,923 | 6,835 | 10,896 | 10,525 | $64,967,682 | $98,708,605 | 1.519x |
Running Total (Corrected)
| Week | Fraud Extracted | Rug Events | Running Total |
|---|---|---|---|
| W23 | $36,779,855 | 8,276 | $426,475,964 |
| W24 | $28,286,427 | 8,164 | $454,762,391 |
| W25 | $34,193,894 | 7,989 | $488,956,285 |
| W26 | $32,102,733 | 7,623 | $521,059,018 |
| W27 | $32,272,069 | 8,205 | $553,331,087 |
| W28 | $37,486,843 | 8,343 | $590,817,930 |
| W29 | $33,740,923 | 6,835 | $624,558,853 |
Note: All figures on this page were corrected on 2026-08-05 to remove a USD double-counting bug in the underlying calculation. Data covers PancakeSwap V2, PancakeSwap V3, Uniswap V2, and Uniswap V3 throughout the tracked period.
About This Tracker
ChainAware.ai’s weekly rug pull tracker monitors liquidity removal fraud across PancakeSwap V2, PancakeSwap V3, Uniswap V2, and Uniswap V3. Rug pull fraud is defined as the USD-equivalent value of liquidity removed by the pool creator that exceeds the USD-equivalent value of liquidity added by the creator – a net extraction event, measured in USD-side value only. The tracker uses ChainAware’s predictive rug pull detection engine, which achieves 90.1% detection accuracy in V3 – see the full Rug Pull Detector methodology for how the model scores deployer wallets and liquidity events.