
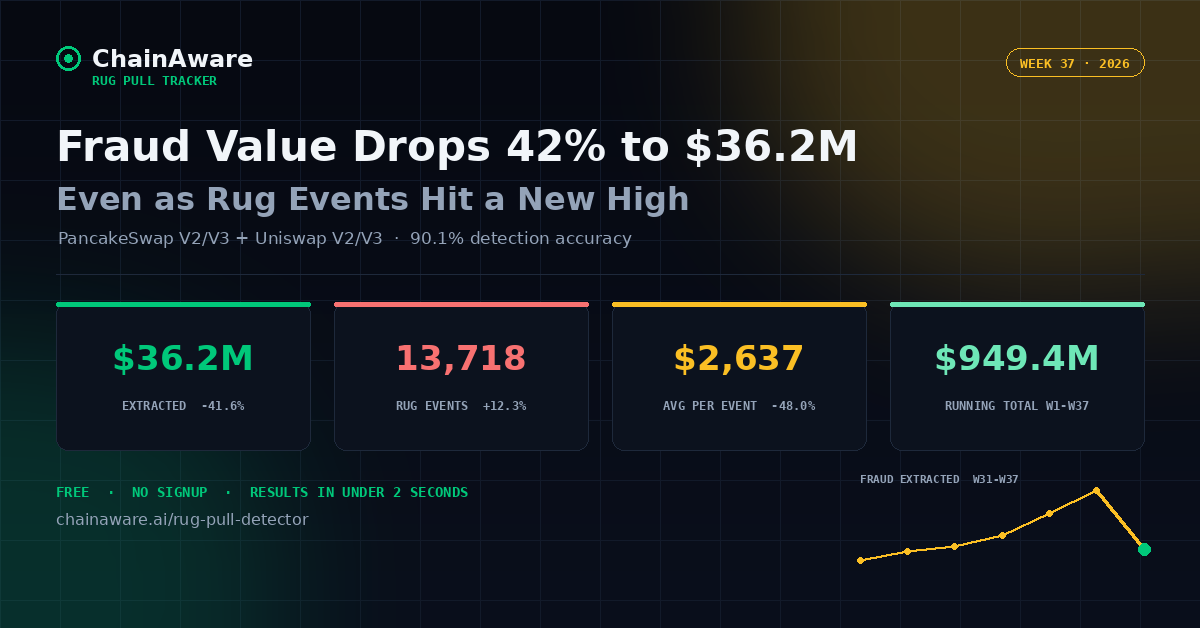
Data covers PancakeSwap V2, PancakeSwap V3, Uniswap V2, and Uniswap V3. Week 37 = week ending Sunday, September 13, 2026.
Week 37 broke the four-week streak of rising fraud values. $36,172,288 was extracted from retail investors – down 41.6% from Week 36’s $61,963,555 – even as rug pull events climbed 12.3% to 13,718, a new high for the current tracked window. New pool mints also rose 13.5% to 18,892. The running total since tracking began now stands at $949,401,987, closing in on the $1B mark.
Week 37 Key Numbers
Week 37 Analysis
Fraud Value Falls Sharply Even as Events and Mints Both Rise
The 41.6% drop in extracted fraud is the largest single-week decline recorded since the tracker adopted its current methodology, and it comes despite rug pull events rising 12.3% to a new high of 13,718 and new pool mints rising 13.5% to 18,892. This is a clear break from the pattern of the prior four weeks, where fraud value consistently outpaced or matched event growth. Average extraction per event fell to $2,637, down 48.0% from Week 36’s $5,072 – by far the lowest average per event in the tracked window – indicating this week’s rug pulls were, on average, considerably smaller in scale even though there were more of them.
Total Pools Growth Moderates Sharply
Total pools tracked rose 9.9% to 112,329, a far more modest increase than the roughly 59-172% weekly jumps seen in each of the prior two weeks. This suggests the unusual pool-count surge that characterized Weeks 35 and 36 has largely run its course, with growth this week driven proportionally by new mints (+13.5%) rather than a disproportionate influx of existing pools re-entering the dataset – a healthier-looking pattern than the prior two weeks’ divergence.
Rug-to-Mint Ratio and Removed-to-Added Ratio Hold Roughly Steady
The rug-to-mint ratio eased slightly to 72.6% from 73.4%, remaining in the elevated 70%+ range that has held since Week 34. The removed-to-added liquidity ratio ticked up marginally to 1.521x from 1.514x, continuing its gradual multi-week climb even as the absolute dollar figures on both sides of that ratio fell sharply from last week’s levels.
Week-on-Week Comparison: W35 – W37
| Metric | W35 | W36 | W37 | W37 vs W36 |
|---|---|---|---|---|
| Fraud extracted | $51,639,440 | $61,963,555 | $36,172,288 | -41.6% |
| Rug events | 12,140 | 12,216 | 13,718 | +12.3% |
| Total pools | 63,693 | 102,231 | 112,329 | +9.9% |
| New mints | 15,890 | 16,643 | 18,892 | +13.5% |
| Added by creators | $109,398,521 | $120,659,059 | $69,406,368 | -42.5% |
| Removed by creators | $161,037,961 | $182,622,615 | $105,578,656 | -42.2% |
| Removed-to-added ratio | 1.472x | 1.514x | 1.521x | +0.5% |
2026 Running Total – W31 to W37
| Week | Fraud Extracted | Rug Events | Running Total |
|---|---|---|---|
| W31 | $31,426,931 | 7,156 | $685,296,210 |
| W32 | $35,004,484 | 7,910 | $720,300,694 |
| W33 | $37,307,338 | 8,898 | $757,608,032 |
| W34 | $42,211,158 | 11,688 | $799,819,190 |
| W35 | $51,639,440 | 12,140 | $851,458,630 |
| W36 | $61,963,555 | 12,216 | $913,422,185 |
| W37 | $36,172,288 | 13,718 | $949,401,987 |
Note: Data covers PancakeSwap V2, PancakeSwap V3, Uniswap V2, and Uniswap V3 throughout the tracked period. All figures use the corrected USD-only extraction methodology adopted 2026-08-05. W32 through W36 fraud totals were revised slightly this week to reflect late-arriving backfilled events; the running total reflects these revisions.
About This Tracker
ChainAware.ai’s weekly rug pull tracker monitors liquidity removal fraud across PancakeSwap V2 and V3 on BNB Smart Chain and Uniswap V2 and V3 on Ethereum. Rug pull fraud is defined as the USD-equivalent value of liquidity removed by the pool creator that exceeds the USD-equivalent value of liquidity added by the creator – a net extraction event, measured in USD-side value only. The tracker uses ChainAware’s predictive rug pull detection engine, which achieves 90.1% detection accuracy in V3 – see the full Rug Pull Detector methodology for how the model scores deployer wallets and liquidity events.