
Data covers PancakeSwap (BNB Smart Chain and Ethereum), Uniswap (Ethereum, Base and Polygon), and SushiSwap (Ethereum, Base and Polygon), all pool versions. Week 39 = week ending Sunday, September 27, 2026.
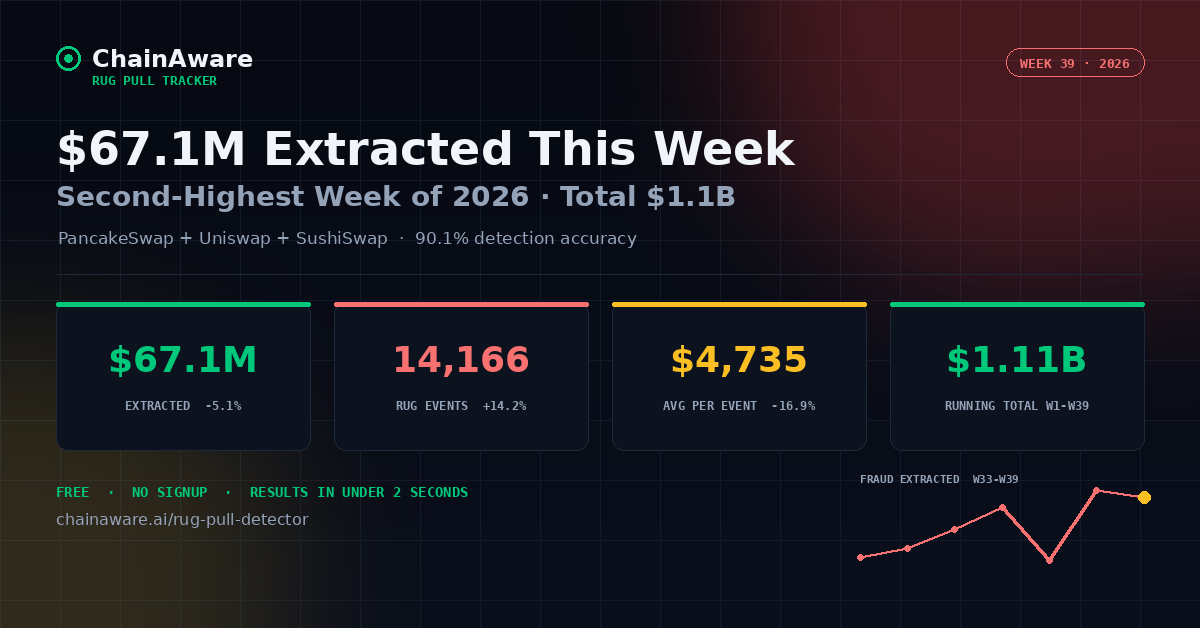
Week 39 saw $67,080,251 extracted from retail investors – down 5.1% from Week 38’s $70,688,513, which was the highest weekly total of 2026. Week 39 is the second-highest week of the year, so the two largest weeks of 2026 have now come back to back. Rug pull events rose 14.2% to 14,166 and new pool mints rose 14.6% to 18,796. The running total since 2026 tracking began crossed $1 billion in Week 38 and now stands at $1,114,012,303.
Week 39 Key Numbers
Week 39 Analysis
Two Back-to-Back Weeks Above $65M
Weeks 38 and 39 together account for $137,768,764 of extraction, the two largest weekly totals of 2026. Week 39’s $67.1M sits 21.4% above the average of the four weeks before it (Weeks 35-38 averaged $55.2M), and the pullback from Week 38 is modest at 5.1%. Week 38 was the largest week since Week 50 of 2025 ($72.6M), so extraction is now running at a level not seen since December 2025.
More Events, Smaller Average Extraction
Rug pull events rose 14.2% to 14,166 while fraud value fell 5.1%, so the average extraction per event dropped to $4,735 from Week 38’s $5,698 (-16.9%). Even after that decline, $4,735 is the fourth-highest weekly average of 2026, behind Weeks 38, 36 and 29. Week 38’s high average came from fewer, larger events (12,406); Week 39 reverted partway toward a higher count of smaller ones.
Tracked Pools Stay Elevated; Mints Stay in Range
Total pools tracked rose 22.5% to 115,597 after falling 19.5% in Week 38, and the count has now stayed above 90,000 for four consecutive weeks (Weeks 36-39), against 26,377 as recently as Week 34. New pool mints have been far steadier, ranging between 16,402 and 22,622 over the same four weeks. The gap between the two series, which we flagged in earlier reports, has therefore persisted rather than reversed, and total pools should still be read separately from mint activity.
Removed-to-Added Ratio Rises for a Sixth Straight Week
Creators removed $1.55 for every $1.00 they seeded in Week 39 (1.554x), up from 1.545x in Week 38 and 1.526x in Week 37 – the sixth consecutive weekly rise since Week 33’s 1.389x, and the highest ratio since Week 19. The rug-to-mint ratio was 75.4%, essentially level with Week 38’s 75.6% and just below the 2026 high of 76.8% set in Week 35: in every week since Week 35, between 71% and 77% of new pool mints have ended in a confirmed rug pull.
Week-on-Week Comparison: W37 – W39
| Metric | W37 | W38 | W39 | W39 vs W38 |
|---|---|---|---|---|
| Fraud extracted | $36,627,957 | $70,688,513 | $67,080,251 | -5.1% |
| Rug events | 16,042 | 12,406 | 14,166 | +14.2% |
| Total pools | 117,309 | 94,378 | 115,597 | +22.5% |
| New mints | 22,622 | 16,402 | 18,796 | +14.6% |
| Added by creators | $69,683,368 | $129,634,666 | $121,095,618 | -6.6% |
| Removed by creators | $106,311,325 | $200,323,179 | $188,175,869 | -6.1% |
| Removed-to-added ratio | 1.526x | 1.545x | 1.554x | +0.6% |
| Average extraction per event | $2,283 | $5,698 | $4,735 | -16.9% |
2026 Running Total – W33 to W39
| Week | Fraud Extracted | Rug Events | Running Total |
|---|---|---|---|
| W33 | $37,633,792 | 8,965 | $783,555,666 |
| W34 | $42,429,877 | 11,778 | $825,985,543 |
| W35 | $51,651,965 | 12,225 | $877,637,508 |
| W36 | $61,978,074 | 12,375 | $939,615,582 |
| W37 | $36,627,957 | 16,042 | $976,243,539 |
| W38 | $70,688,513 | 12,406 | $1,046,932,052 |
| W39 | $67,080,251 | 14,166 | $1,114,012,303 |
Note on expanded coverage and restated figures: earlier weekly reports covered PancakeSwap on BNB Smart Chain and Uniswap on Ethereum. The tracker now also covers PancakeSwap on Ethereum, Uniswap on Base and Polygon, and SushiSwap on Ethereum, Base and Polygon (all pool versions), and the added coverage has been imported back across earlier weeks. Every weekly figure in this article therefore reflects the expanded scope and is higher than originally reported for the same week. Running totals are recalculated by summing every weekly value since 2026-W01 on this basis, so they are higher than in previous weekly reports (for example, $949,401,987 through Week 37 in our Week 37 report versus $976,243,539 here). Week 37 shows 16,042 events and $36,627,957 above, compared with 13,718 events and $36,172,288 originally reported. All figures use the corrected USD-only extraction methodology adopted 2026-08-05.
About This Tracker
ChainAware.ai’s weekly rug pull tracker monitors liquidity removal fraud across PancakeSwap on BNB Smart Chain and Ethereum, and Uniswap and SushiSwap on Ethereum, Base and Polygon, covering all pool versions. Rug pull fraud is defined as the USD-equivalent value of liquidity removed by the pool creator that exceeds the USD-equivalent value of liquidity added by the creator – a net extraction event, measured in USD-side value only. The tracker uses ChainAware’s predictive rug pull detection engine, which achieves 90.1% detection accuracy in V3 – see the full Rug Pull Detector methodology for how the model scores deployer wallets and liquidity events.