
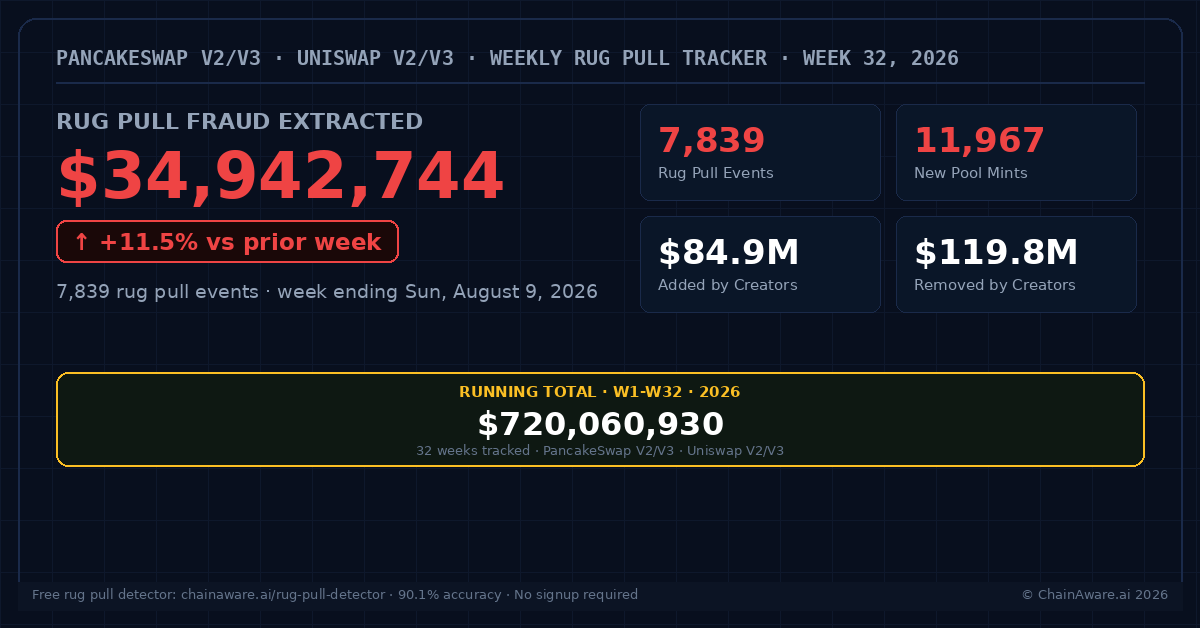
Data covers PancakeSwap V2, PancakeSwap V3, Uniswap V2, and Uniswap V3. Week 32 = week ending Sunday, August 9, 2026.
Week 32 extended the reacceleration that began in Week 31. $34,942,744 was extracted from retail investors – up 11.5% from Week 31’s $31,349,015. 7,839 confirmed rug pull events were recorded this week, the highest weekly count since Week 28’s 8,351 – though still well below the 2026 peak of 8,677 set in Week 21. The running total since tracking began now stands at $720,060,930.
Week 32 Key Numbers
Week 32 Analysis
Second Straight Week of Rising Fraud and Activity Together
Unlike the divergent patterns seen in several recent weeks, Week 32 saw fraud value, rug events, pool creation, and new mints all rise together. Total pools jumped 13.4% to 11,741, new mints rose 8.8% to 11,967, and rug events climbed 9.9% to 7,839 – the highest weekly event count since Week 28’s 8,351, though still short of the 2026 high of 8,677 set back in Week 21. The broad-based nature of this increase – every major metric moving in the same direction – suggests genuine growth in overall pool creation activity rather than a shift in the composition of what’s being tracked.
Extraction Efficiency Also Ticked Up
The removed-to-added liquidity ratio rose to 1.412x from 1.387x in Week 31 – creators removed $1.41 for every $1.00 they seeded, continuing to climb after two straight weeks of easing. Average extraction per rug event was $4,458, up 1.4% from Week 31’s $4,397. Both figures point to a slightly more aggressive extraction pattern this week, on top of – not instead of – the higher raw activity.
Rug-to-Mint Ratio Holds Steady
The rug-to-mint ratio was 65.5% this week, essentially flat versus Week 31’s 64.8%. With both the numerator (rug events) and denominator (new mints) growing at a similar pace, the overall conversion rate from launch to rug has stayed consistent even as the absolute scale of activity increased – this looks like more of the same pattern happening at a larger scale, rather than a change in underlying behavior.
Week-on-Week Comparison: W30 – W32
| Metric | W30 | W31 | W32 | W32 vs W31 |
|---|---|---|---|---|
| Fraud extracted | $28,556,485 | $31,349,015 | $34,942,744 | +11.5% |
| Rug events | 6,574 | 7,130 | 7,839 | +9.9% |
| Total pools | 10,099 | 10,351 | 11,741 | +13.4% |
| New mints | 9,755 | 11,000 | 11,967 | +8.8% |
| Added by creators | $69,046,148 | $81,108,175 | $84,859,022 | +4.6% |
| Removed by creators | $97,602,633 | $112,457,190 | $119,801,766 | +6.5% |
| Removed-to-added ratio | 1.412x | 1.387x | 1.412x | +1.8% |
2026 Running Total – W26 to W32
| Week | Fraud Extracted | Rug Events | Running Total |
|---|---|---|---|
| W26 | $32,113,192 | 7,632 | $521,669,284 |
| W27 | $32,308,212 | 8,214 | $553,977,496 |
| W28 | $37,491,216 | 8,351 | $591,468,712 |
| W29 | $33,743,974 | 6,838 | $625,212,686 |
| W30 | $28,556,485 | 6,574 | $653,769,171 |
| W31 | $31,349,015 | 7,130 | $685,118,186 |
| W32 | $34,942,744 | 7,839 | $720,060,930 |
Note: Data covers PancakeSwap V2, PancakeSwap V3, Uniswap V2, and Uniswap V3 throughout the tracked period. All figures use the corrected USD-only extraction methodology adopted 2026-08-05. Figures for prior weeks may be restated slightly from earlier publications as data reconciles.
About This Tracker
ChainAware.ai’s weekly rug pull tracker monitors liquidity removal fraud across PancakeSwap V2 and V3 on BNB Smart Chain and Uniswap V2 and V3 on Ethereum. Rug pull fraud is defined as the USD-equivalent value of liquidity removed by the pool creator that exceeds the USD-equivalent value of liquidity added by the creator – a net extraction event, measured in USD-side value only. The tracker uses ChainAware’s predictive rug pull detection engine, which achieves 90.1% detection accuracy in V3 – see the full Rug Pull Detector methodology for how the model scores deployer wallets and liquidity events.