
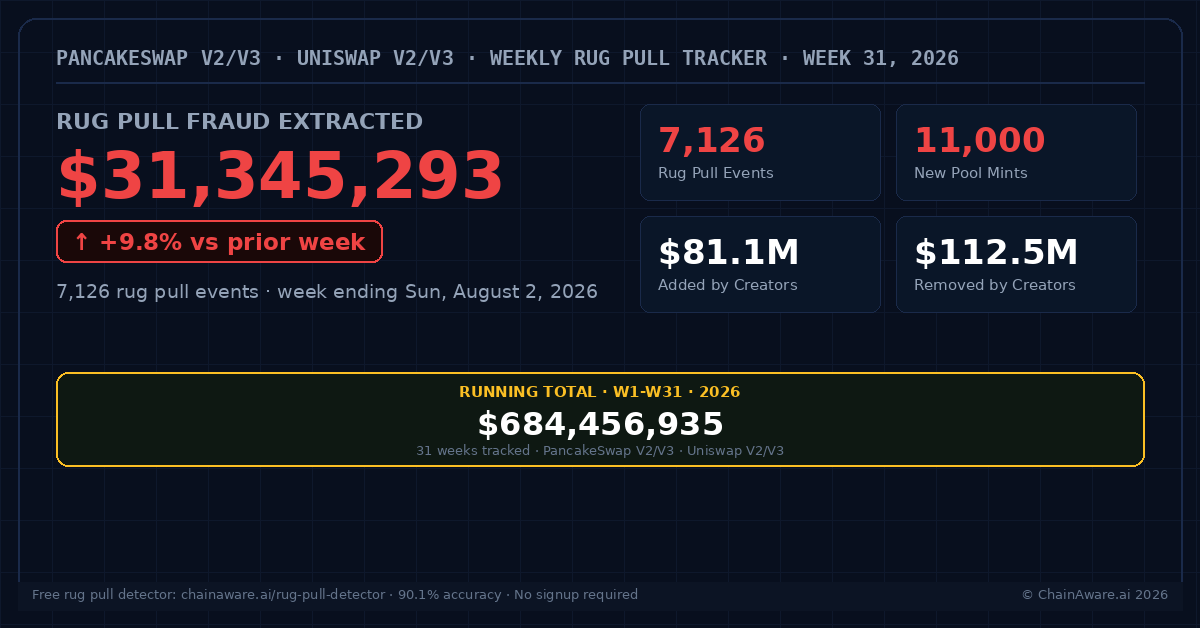
Data covers PancakeSwap V2, PancakeSwap V3, Uniswap V2, and Uniswap V3. Week 31 = week ending Sunday, August 2, 2026.
Week 31 saw $31,345,293 extracted from retail investors – up 9.8% from Week 30’s $28,552,789. 7,126 confirmed rug pull events were recorded this week, the highest weekly event count since Week 23. The running total since tracking began now stands at $684,456,935.
Week 31 Key Numbers
Week 31 Analysis
Rug Events Hit Their Highest Level Since Week 23
7,126 rug pull events is the highest weekly count since Week 23’s 8,276, and continues an upward trend that has now run for three consecutive weeks in event count terms even as extracted dollar value dipped in Week 30. New pool mints also jumped 12.8% to 11,000 – the first time mints have crossed 11,000 since Week 27 – suggesting the broader token launch environment picked back up this week after the quieter W29-W30 period.
Fraud Value Reaccelerates, But Roughly in Line With Activity
The 9.8% rise in extracted fraud tracked closely with the 8.5% rise in rug events and the 12.8% rise in new mints – unlike some recent weeks where fraud value and activity moved at very different rates. Average extraction per event was $4,399, up only 1.2% from Week 30’s $4,347, indicating this week’s increase was driven mainly by more rug events happening, not by each individual rug becoming more lucrative.
Removed-to-Added Ratio Eases Slightly
The removed-to-added liquidity ratio was 1.386x this week, down slightly from 1.414x in Week 30 – creators removed $1.39 for every $1.00 they seeded, a marginal easing in extraction efficiency even as raw activity picked up. The rug-to-mint ratio eased to 64.8% from 67.3%, consistent with the larger pool of new mints this week diluting the share that ended in a rug pull, even though the absolute number of rug events rose.
Week-on-Week Comparison: W29 – W31
| Metric | W29 | W30 | W31 | W31 vs W30 |
|---|---|---|---|---|
| Fraud extracted | $33,740,923 | $28,552,789 | $31,345,293 | +9.8% |
| Rug events | 6,835 | 6,568 | 7,126 | +8.5% |
| Total pools | 10,896 | 10,099 | 10,351 | +2.5% |
| New mints | 10,525 | 9,755 | 11,000 | +12.8% |
| Added by creators | $64,967,682 | $69,046,148 | $81,108,175 | +17.5% |
| Removed by creators | $98,708,605 | $97,598,937 | $112,453,468 | +15.2% |
| Removed-to-added ratio | 1.519x | 1.414x | 1.386x | -1.9% |
2026 Running Total – W25 to W31
| Week | Fraud Extracted | Rug Events | Running Total |
|---|---|---|---|
| W25 | $34,193,894 | 7,989 | $488,956,285 |
| W26 | $32,102,733 | 7,623 | $521,059,018 |
| W27 | $32,272,069 | 8,205 | $553,331,087 |
| W28 | $37,486,843 | 8,343 | $590,817,930 |
| W29 | $33,740,923 | 6,835 | $624,558,853 |
| W30 | $28,552,789 | 6,568 | $653,111,642 |
| W31 | $31,345,293 | 7,126 | $684,456,935 |
Note: Data covers PancakeSwap V2, PancakeSwap V3, Uniswap V2, and Uniswap V3 throughout the tracked period. All figures use the corrected USD-only extraction methodology adopted 2026-08-05.
About This Tracker
ChainAware.ai’s weekly rug pull tracker monitors liquidity removal fraud across PancakeSwap V2 and V3 on BNB Smart Chain and Uniswap V2 and V3 on Ethereum. Rug pull fraud is defined as the USD-equivalent value of liquidity removed by the pool creator that exceeds the USD-equivalent value of liquidity added by the creator – a net extraction event, measured in USD-side value only. The tracker uses ChainAware’s predictive rug pull detection engine, which achieves 90.1% detection accuracy in V3 – see the full Rug Pull Detector methodology for how the model scores deployer wallets and liquidity events.