
Data covers PancakeSwap V2, PancakeSwap V3, Uniswap V2, and Uniswap V3. Week 36 = week ending Sunday, September 6, 2026.
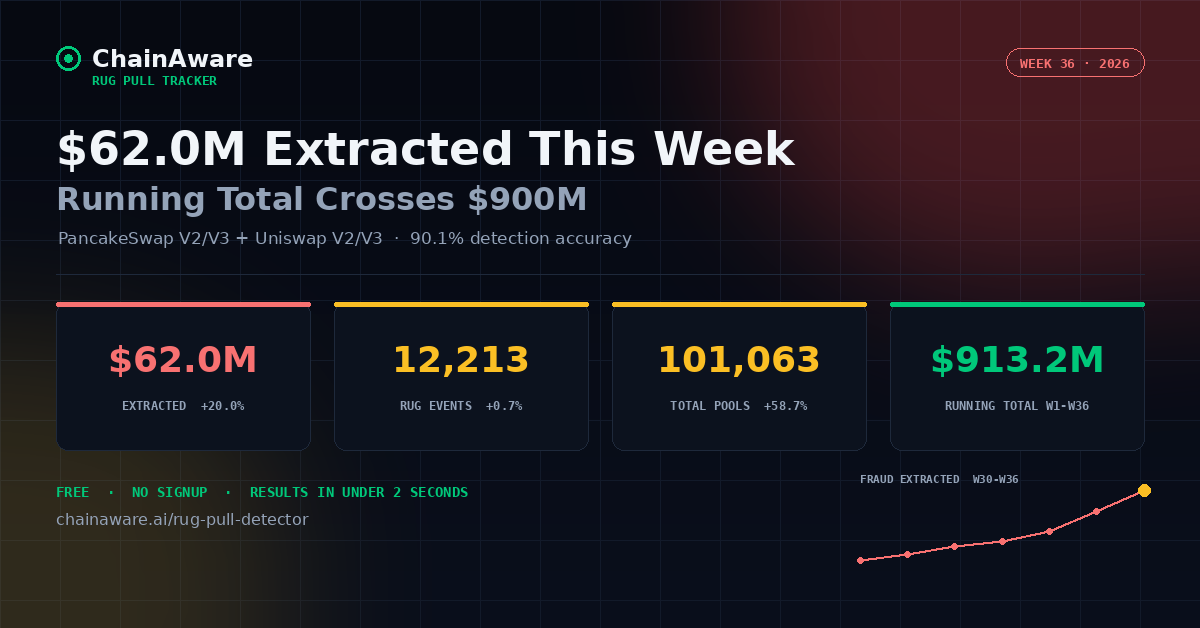
Week 36 saw $61,961,466 extracted from retail investors – up 20.0% from Week 35’s $51,636,581. 12,213 confirmed rug pull events were recorded this week, essentially flat versus Week 35 (+0.7%), while total pools tracked nearly doubled again, up 58.7% to 101,063 – the largest single-week pool count ever recorded, extending last week’s already-record total. The running total since tracking began has now crossed $900M, standing at $913,190,904.
Week 36 Key Numbers
Week 36 Analysis
Running Total Crosses $900M
The cumulative extraction figure crossed $900M this week, reaching $913,190,904 since tracking began. It took roughly 4 weeks to go from $800M to $900M (W34 to W36), a faster pace than the approximately 6 weeks it took to move from $700M to $800M (W28 to W34) – reflecting the acceleration in weekly fraud values seen across the past month.
Total Pools Nearly Double Again, Extending a Two-Week Surge
101,063 total pools tracked is a 58.7% jump from Week 35’s already-record 63,693, and marks the second consecutive week the pool count has roughly doubled – up from 23,025 just two weeks ago, a more than fourfold increase in that span. New pool mints, by contrast, rose only 4.7% to 16,643, a far more modest pace of growth. As in Week 35, this divergence suggests the total-pools figure is being driven substantially by existing pools re-entering the tracked dataset rather than a proportional wave of fresh token launches – a pattern now established across two consecutive weeks and worth continued monitoring.
Average Extraction Per Event Rises Sharply
Rug pull events held essentially flat at 12,213 (+0.7%), while fraud value rose 20.0% – meaning this week’s growth came almost entirely from larger individual extractions rather than more of them. Average extraction per event rose to $5,073, up 19.2% from Week 35’s $4,256, the highest average per event recorded since the tracker adopted its current methodology. The removed-to-added liquidity ratio also climbed to 1.514x, a new high, up from 1.472x last week.
Week-on-Week Comparison: W34 – W36
| Metric | W34 | W35 | W36 | W36 vs W35 |
|---|---|---|---|---|
| Fraud extracted | $42,191,888 | $51,636,581 | $61,961,466 | +20.0% |
| Rug events | 11,677 | 12,133 | 12,213 | +0.7% |
| Total pools | 23,025 | 63,693 | 101,063 | +58.7% |
| New mints | 16,223 | 15,890 | 16,643 | +4.7% |
| Added by creators | $101,626,264 | $109,398,381 | $120,659,059 | +10.3% |
| Removed by creators | $143,818,152 | $161,034,962 | $182,620,525 | +13.4% |
| Removed-to-added ratio | 1.415x | 1.472x | 1.514x | +2.9% |
2026 Running Total – W30 to W36
| Week | Fraud Extracted | Rug Events | Running Total |
|---|---|---|---|
| W30 | $28,604,279 | 6,614 | $653,869,279 |
| W31 | $31,426,859 | 7,152 | $685,296,138 |
| W32 | $34,989,907 | 7,880 | $720,286,045 |
| W33 | $37,307,338 | 8,895 | $757,593,383 |
| W34 | $42,191,888 | 11,677 | $799,785,271 |
| W35 | $51,636,581 | 12,133 | $851,421,852 |
| W36 | $61,961,466 | 12,213 | $913,190,904 |
Note: Data covers PancakeSwap V2, PancakeSwap V3, Uniswap V2, and Uniswap V3 throughout the tracked period. All figures use the corrected USD-only extraction methodology adopted 2026-08-05. W32 through W35 fraud totals were revised slightly this week to reflect late-arriving backfilled events; the running total reflects these revisions.
About This Tracker
ChainAware.ai’s weekly rug pull tracker monitors liquidity removal fraud across PancakeSwap V2 and V3 on BNB Smart Chain and Uniswap V2 and V3 on Ethereum. Rug pull fraud is defined as the USD-equivalent value of liquidity removed by the pool creator that exceeds the USD-equivalent value of liquidity added by the creator – a net extraction event, measured in USD-side value only. The tracker uses ChainAware’s predictive rug pull detection engine, which achieves 90.1% detection accuracy in V3 – see the full Rug Pull Detector methodology for how the model scores deployer wallets and liquidity events.