
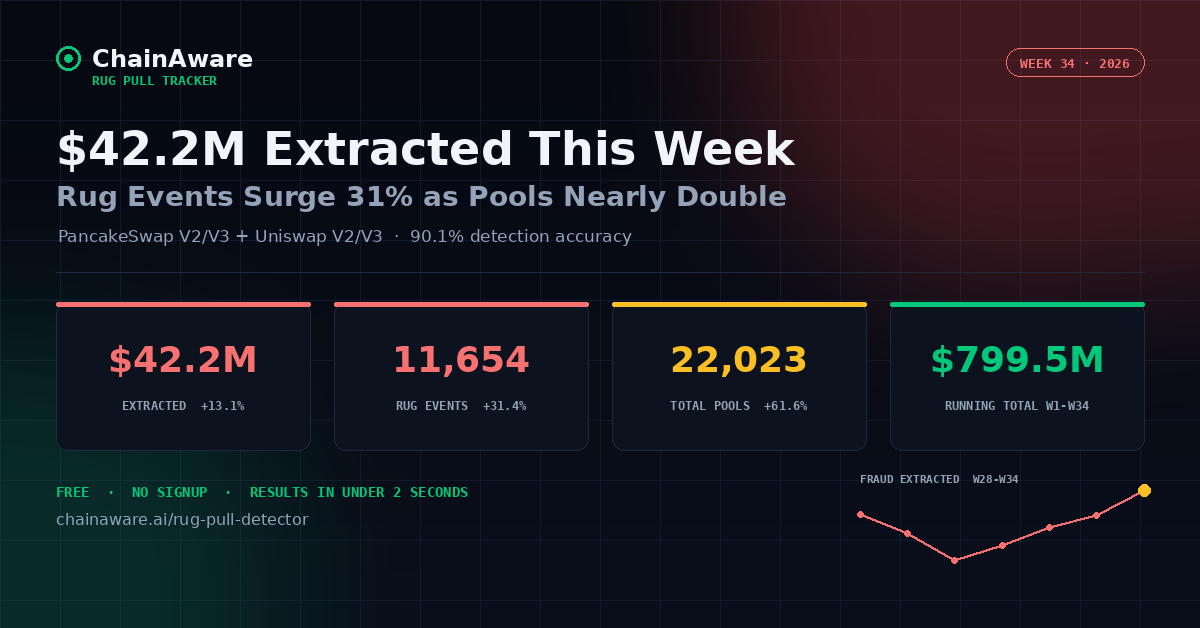
Data covers PancakeSwap V2, PancakeSwap V3, Uniswap V2, and Uniswap V3. Week 34 = week ending Sunday, August 23, 2026.
Week 34 saw $42,166,436 extracted from retail investors – up 13.1% from Week 33’s $37,288,020 (revised from $37,109,706 to reflect late-arriving events). 11,654 confirmed rug pull events were recorded this week, up 31.4% and by far the highest weekly event count since the Week 43-46 2025 surge. Total pools tracked nearly doubled, up 61.6% to 22,023 – the largest single-week pool count since Week 30 2025. The running total since tracking began now stands at $799,516,236.
Week 34 Key Numbers
Week 34 Analysis
Pool Creation Nearly Doubles as Rug Events Cross 11,000
22,023 total pools tracked is a 61.6% jump from Week 33’s 13,625 – the sharpest single-week increase in pool activity since early 2026. New pool mints rose 23.3% to 16,223, a smaller increase than total pools, meaning much of the growth in tracked pools reflects broader activity across existing pools rather than new launches alone. Rug pull events climbed 31.4% to 11,654, the highest weekly count in the current tracked window and a clear break from the 7,000-9,000 range that had held since Week 21.
Fraud Value Rises, But Average Extraction Per Event Falls
The 13.1% rise in extracted fraud was proportionally smaller than the 31.4% rise in rug events, continuing last week’s pattern where activity growth outpaces dollar growth. Average extraction per event fell to $3,618, down 13.9% from Week 33’s $4,204 – the lowest average per event in the past several weeks. This week’s growth was driven by a much higher volume of smaller rug pulls rather than a few large extractions.
Removed-to-Added Ratio Ticks Back Up
The removed-to-added liquidity ratio was 1.415x this week, up from 1.386x in Week 33 – creators removed $1.42 for every $1.00 they seeded, reversing the two-week easing trend. The rug-to-mint ratio also rose sharply, from 67.4% to 71.8%, meaning nearly 3 in 4 new pool mints this week ended in a confirmed rug pull – the highest rug-to-mint ratio recorded since tracking of this metric began.
Week-on-Week Comparison: W32 – W34
| Metric | W32 | W33 | W34 | W34 vs W33 |
|---|---|---|---|---|
| Fraud extracted | $34,958,056 | $37,288,020 | $42,166,436 | +13.1% |
| Rug events | 7,859 | 8,869 | 11,654 | +31.4% |
| Total pools | 11,741 | 13,625 | 22,023 | +61.6% |
| New mints | 11,967 | 13,161 | 16,223 | +23.3% |
| Added by creators | $84,859,022 | $96,643,663 | $101,575,283 | +5.1% |
| Removed by creators | $119,817,078 | $133,931,683 | $143,741,719 | +7.3% |
| Removed-to-added ratio | 1.412x | 1.386x | 1.415x | +2.1% |
2026 Running Total – W28 to W34
| Week | Fraud Extracted | Rug Events | Running Total |
|---|---|---|---|
| W28 | $37,503,003 | 8,363 | $591,398,548 |
| W29 | $33,797,522 | 6,851 | $625,196,070 |
| W30 | $28,581,118 | 6,588 | $653,777,188 |
| W31 | $31,352,583 | 7,135 | $685,129,771 |
| W32 | $34,958,056 | 7,859 | $720,087,827 |
| W33 | $37,288,020 | 8,869 | $757,375,847 |
| W34 | $42,166,436 | 11,654 | $799,516,236 |
Note: Data covers PancakeSwap V2, PancakeSwap V3, Uniswap V2, and Uniswap V3 throughout the tracked period. All figures use the corrected USD-only extraction methodology adopted 2026-08-05. W32 and W33 fraud totals were revised slightly upward this week to reflect late-arriving backfilled events; the running total reflects these revisions.
About This Tracker
ChainAware.ai’s weekly rug pull tracker monitors liquidity removal fraud across PancakeSwap V2 and V3 on BNB Smart Chain and Uniswap V2 and V3 on Ethereum. Rug pull fraud is defined as the USD-equivalent value of liquidity removed by the pool creator that exceeds the USD-equivalent value of liquidity added by the creator – a net extraction event, measured in USD-side value only. The tracker uses ChainAware’s predictive rug pull detection engine, which achieves 90.1% detection accuracy in V3 – see the full Rug Pull Detector methodology for how the model scores deployer wallets and liquidity events.