
ChainAware has published a weekly Agent Trust Tracker for ERC-8004 agents since early in the registry’s life. Read one week at a time, the reports show registrations and scores. Taken together, they show repeating patterns that single reports hide. This guide pulls out four of those patterns, explains what each one means, and shows how defenders can respond.
An open registry produces a stream of data and no verdicts. ERC-8004 records that agents exist. Anyone can register one, and registering costs little. As a result, the registry grew past half a million indexed agents within months. Growth on that scale raises an obvious question: how many of those agents deserve access to money?
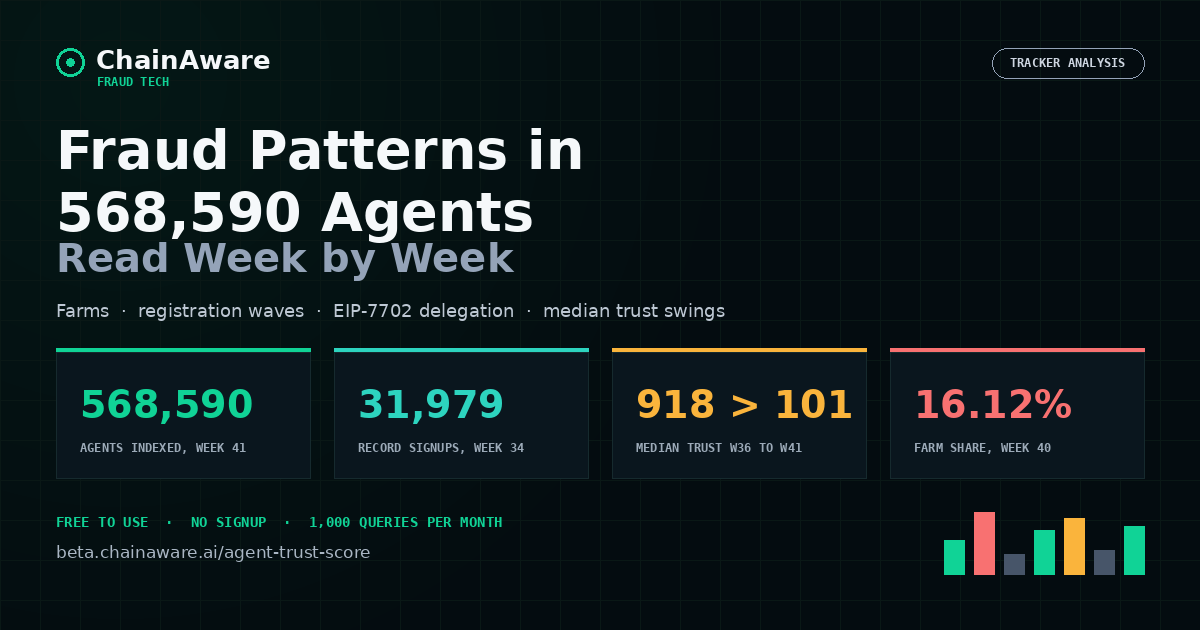
The weekly tracker answers that question with evidence. Each report counts new registrations and unique owners, and it computes agents per owner. It also reports the median trust score of new agents, the tier mix and the share of agents that carry risk flags. By Week 41 of 2026, the index covered 568,590 agents. A series that long reveals behavior that no single week can show.
This article reads the whole series as a story. It starts with a short description of what the tracker measures, then walks through the weeks, and then names four patterns. Each pattern comes with a defensive response, because a pattern only helps when someone can act on it. The article also lists the limits of the data, since honest analysis includes the gaps.
Free Tool
Score Any ERC-8004 Agent in Seconds
Look up an agent or its owner wallet and see its Agent Trust Score, tier and risk flags. Free to use, no signup.
Open the free Agent Trust Score ↗Why the Tracker Exists
A registry that anyone can join tells you who registered. It does not tell you who deserves trust. The ERC-8004 standard gives agents an identity, a place for feedback and a hook for validation. By contrast, the specification says openly that it cannot cryptographically guarantee that an agent’s advertised capabilities work as described, and it admits that Sybil attacks are possible. Independent measurement therefore has to supply what the registry leaves out.
ChainAware built the Agent Trust Score for that purpose. It scores each indexed agent from 0 to 1,000 and places it in one of five tiers: Sovereign, Trusted, Provisional, Elevated Risk or Untrusted. The score rests on three pillars, which are the owner wallet’s fraud probability, the feeder address that funded the owner and the creator’s record of rug pulls and honeypots. Fleet-level farm detection adds a view across agents. The launch article describes the model in full.
Every week, the tracker applies the score to the whole registry. It turns a static rating into a time series, and a time series shows direction. Counterparties can see whether the population is improving or deteriorating, and they can tune their own policies accordingly.
What the Tracker Measures
Each weekly report uses a stable set of measures.
- New registrations. Agents that registered during the week.
- Unique owners. Distinct owner wallets behind those registrations.
- Agents per owner. New registrations divided by unique owners, a simple concentration ratio.
- Median trust of new agents. Middle score of that week’s new registrations.
- Indexed population. Total number of agents in the index.
- Tier mix. Portion of agents in each of the five tiers.
- Flag shares. The share of agents that carry farm, feeder, creator and delegation flags.
These measures work together. Registrations show volume. Owners and agents per owner show concentration. The median shows quality. Flags show why the quality moved.
Chains and Coverage
The index covers agents on Ethereum, BNB Smart Chain, Base and Avalanche C-Chain, and Mantle support is in progress. ERC-8004 went live on Ethereum mainnet in January 2026, and other chains followed. The Week 41 report noted that Base alone added 37,037 agents since the previous snapshot, which shows how quickly activity can shift between chains.
Coverage has limits. ChainAware traced a feeder for roughly 38% of indexed agents, so funding evidence is missing for many. The tracker also covers only agents that ChainAware has indexed, not every agent that exists. Later sections return to these limits.
Week by Week: The Published Data
The table below collects figures from the published tracker posts. It starts at Week 29 and runs to Week 41.
| Week | New agents | Unique owners | Agents per owner | Median trust of new agents |
|---|---|---|---|---|
| 29 | 11,026 | n/a | n/a | 406 |
| 30 | 22,989 | n/a | n/a | 299 |
| 31 | 21,378 | 8,413 | 2.54 | 200 |
| 32 | 15,652 | n/a | n/a | 521 |
| 33 | 10,361 | 9,511 | 1.09 | 473 |
| 34 | 31,979 | 27,033 | 1.18 | 563 |
| 35 | 29,601 | 18,344 | 1.61 | 573 |
| 36 | 24,173 | 13,646 | 1.77 | 918 |
| 37 | 9,745 | 6,721 | 1.45 | 572 |
| 38 | 17,001 | 7,405 | 2.30 | 200 |
| 39 | 5,720 | 4,307 | 1.33 | 465 |
| 40 | 6,893 | n/a | n/a | 200 |
| 41 | 10,706 | 7,435 | 1.44 | 101 |
Agents per owner comes from dividing new agents by unique owners where both figures appear in the reports. The next section narrates the weeks in order, because the numbers make more sense as a story.
Weeks 29 to 31: Low Trust and a Concentration Spike
Week 29 recorded 11,026 new agents, down 54.9% from the week before. The median trust of new agents fell 12.5% to 406. Across all 317,589 indexed agents, the population split into two camps: 27.5% sat in the Untrusted tier and 21.3% in the Sovereign tier, with few in between. The Week 29 report gives the full tier breakdown.
Week 30 more than doubled registrations to 22,989. Unique owners grew almost as fast, up 96.9%, so the growth looked broad-based. Even so, the median trust dropped 26.4% to 299 and entered the Elevated Risk tier, the lowest level since Week 20.
Week 31 changed the picture. Registrations fell only 7.0% to 21,378, but unique owners collapsed 58.7% to 8,413. Agents per owner more than doubled to 2.54. Median trust fell another 33.1% to 200, the floor of the Elevated Risk tier. The Week 31 report called the pattern concentrated rather than broad-based growth.
Weeks 32 to 35: Recovery and a Record
Week 32 brought a rebound. Registrations fell 26.8% to 15,652, yet unique owners rose 76.3%, which reversed the concentration spike. Median trust jumped 160.5% to 521. That week also introduced a full flag breakdown, which showed that 18.73% of indexed agents carried the Sybil-farm flag. The Week 32 report summarized it as farm detection flagging one agent in five.
Week 33 saw registrations fall 33.8% to 10,361, and owners fell 35.9% to 9,511. Median trust cooled 9.2% to 473, still in the Provisional tier. Farm flags covered 18.39% of the 387,255 indexed agents.
Week 34 set the registration record. New agents tripled, up 208.6% to 31,979, and unique owners rose 184.2% to 27,033. Median trust climbed 19.0% to 563, the best level since Week 26. The indexed population reached 419,782, and the farm share eased to 17.05%.
Week 35 held most of the gains. New agents eased 7.4% to 29,601, owners fell 32.1% to 18,344, and agents per owner climbed to 1.61. Median trust held steady at 573, and the population reached 470,961.
Weeks 36 to 39: Record Highs and Sharp Reversals
Week 36 produced the highest median trust on record, 918, which was the first time the weekly median reached the Sovereign tier. Registrations slipped 18.3% to 24,173, and owners fell 25.6% to 13,646. The Week 36 report noted that agents per owner rose for a third week to 1.77.
Still, the record did not last. Week 37 registrations fell 59.7% to 9,745, owners fell 50.7% to 6,721, and median trust dropped 37.7% to 572. However, Week 38 rebounded 74.5% to 17,001 registrations, but owners rose only 10.2% to 7,405, so agents per owner hit 2.30. Median trust fell 65.0% to 200, the bottom of the Elevated Risk tier. Week 39 then fell 66.4% to 5,720 registrations, the lowest since Week 14, with owners down 41.8% to 4,307 and median trust recovering 132.5% to 465.
Weeks 40 and 41: A Record Low
Week 40 saw 6,893 registrations, up 20.5%, while median trust returned to 200. The indexed population reached 518,885. Since Week 35, the Sybil-farm share had moved to 16.12%, and EIP-7702 delegation had risen 33.8%.
Week 41 brought 10,706 registrations, up 55.3%, with unique owners up 50.0% to 7,435. Median trust fell 49.5% to 101, the lowest weekly median since tracking began in Week 5. The index reached 568,590 agents. Furthermore, the share of agents with an unknown feeder nearly doubled to 12.84%. The Week 41 report lays out the details.
Pattern 1: Volume Does Not Equal Quality
The first lesson from the series is the weak link between registration counts and trust. Large weeks can be good or bad. Small weeks can be good or bad. A dashboard that celebrates registration growth, as many registry statistics do, says nothing about whether the new agents deserve access.
| Week | New agents | Median trust | Reading |
|---|---|---|---|
| 34 | 31,979 | 563 | Record volume, solid quality |
| 36 | 24,173 | 918 | Large volume, record quality |
| 38 | 17,001 | 200 | Medium volume, floor of Elevated Risk |
| 39 | 5,720 | 465 | Lowest volume since Week 14, recovering quality |
| 40 | 6,893 | 200 | Low volume, low quality |
| 41 | 10,706 | 101 | Rising volume, record-low quality |
Week 34 and Week 41 make the clearest pair. Likewise, Week 34 set the record for registrations and still produced a median of 563. Week 41 registered about a third as many agents and produced a median of 101. If volume predicted quality, the order would have run the other way.
Why Volume and Quality Diverge
Three forces explain the gap.
First, registration is open and cheap. Anyone can register, and the registry does not filter. Volume therefore reflects how many people choose to register, and it says nothing about who they are.
Second, a few large operators can dominate a week. When one operator registers thousands of agents with weak funding, the median moves sharply, regardless of how many honest developers register the same week. The swing from a record 918 in Week 36 to 572 in Week 37 shows how fast the median can move.
Third, quality depends on the operator mix. Weeks with many independent owners tend to produce better medians than weeks that concentrate on a few. Week 34 had 27,033 unique owners, and Week 41 had 7,435. The owner mix explains much of the difference.
What It Means for Defenders
Teams should stop using registry growth as a health metric. A rise in registrations tells you that more agents exist, not that more agents deserve access. Better indicators include the tier mix, the median trust of new agents and the share of agents with risk flags. Defenders can use those indicators to tighten or relax policy as conditions change.
Pattern 2: Concentration Bursts
The second pattern appears in the ratio of agents to owners. When registrations hold steady or rise while the number of unique owners falls, a few operators account for the growth. The agents-per-owner ratio captures this effect in one number.
Week 31: The Clearest Case
Week 31 shows the pattern most clearly. Registrations dropped only 7.0% to 21,378. Unique owners collapsed 58.7% to 8,413. Agents per owner more than doubled to 2.54, and median trust fell 33.1% to 200.
Put plainly, almost the same number of agents arrived from less than half as many owners. The new agents were also worse on average. Beyond that, the two facts fit together, because operators that register agents in bulk tend to fund them cheaply and quickly.
Week 38: The Repeat
Week 38 repeated the shape. Registrations rebounded 74.5% to 17,001. Unique owners rose only 10.2% to 7,405. Agents per owner reached 2.30, the highest since Week 31. Median trust dropped 65.0% to 200.
The repeat matters. A one-off spike could be noise. Two spikes with the same signature suggest that the same kind of operator returns when conditions allow.
The Contrast: Broad-Based Growth
Week 30 offers a useful contrast. Registrations more than doubled to 22,989, and owners grew almost as fast, up 96.9%. That is broad-based growth. The median trust still fell to 299, so quality was weak, but the week did not carry the concentration signature. Week 34 showed an even clearer example, with 27,033 owners behind 31,979 agents, or about 1.18 agents per owner.
The comparison teaches a practical rule. Look at the ratio before you look at the volume. A big week with a low ratio suggests many independent participants. At the same time, a big week with a high ratio suggests operators at work.
How Defenders Can Respond
Defenders can respond to concentration in three ways.
- Aggregate by owner. Count limits, spend and requests across all agents of one owner, not per agent.
- Aggregate by feeder. Group owners that share a funding source, because operators often split ownership across wallets.
- Tighten during bursts. When the ratio rises above about 2.0, raise the minimum tier for sensitive access until the burst fades.
These steps make splitting pointless. An operator that spreads one request across fifty agents gains nothing when the protocol counts the group as one.
Book a Demo
Turn Tracker Signals Into Access Policy
Talk to the ChainAware team about tier thresholds, fleet limits and automated checks for agents that reach your protocol, marketplace or payment flow.
Book a ChainAware demo ↗Pattern 3: Farms That Stay Large
The third pattern is persistent. Sybil-farm detection flagged 21.1% of agents in the launch analysis of 274,792. Later weeks reported shares between about 16% and 19%: 18.73% in Week 32, 18.39% in Week 33, 17.05% in Week 34 and 16.12% in Week 40.
Reading the Trend
The share eased as the population grew. That could mean two things. Either farms grew more slowly than honest registrations, or the flagged group stayed constant while the total expanded. The absolute numbers point to the second reading. When the index holds 568,590 agents, even 16% represents a large group, more than eighty thousand agents.
The easing also suggests no real improvement. A falling share can hide a rising count. Defenders should track both the share and the absolute number.
Why Farms Matter
Farms matter for three reasons.
- They inflate registry counts. Headlines about agent growth overstate the number of independent participants.
- They manufacture reputation. Farm wallets can review one another’s agents to look established, since the registry blocks only owner self-review and cannot see shared control.
- They capture incentives. Programs built for many independent users pay out to a few operators.
How Farms Get Detected
Fleet detection compares agents with one another. It looks at shared funding, registration timing, clustered ownership and template metadata. No single signal proves a farm, because legitimate teams also register agents in batches. The combination, however, is hard to explain innocently. Our guide to Web3 Sybil protection systems compares the main approaches to this problem across the market.
How Defenders Can Respond
Never read an agent count as a count of independent participants. Ask how many operators stand behind the number. Treat linked agents as one risk unit, and apply the weakest tier in a group to all its members until the operator proves independence.
Pattern 4: Funding That Gets Harder to Trace
The fourth pattern concerns funding chains. Notably, the unknown-feeder share stood at 9.5% in the launch analysis. By Week 41, it had nearly doubled to 12.84%. The feeder, which is the address that first funded the owner wallet, is the hardest signal to fake. An untraceable feeder weakens it.
Why the Unknown Share Rises
Several causes can raise the unknown share. Operators who want to hide their funding can add hops through fresh wallets. Cross-chain bridges can break the visible link between source and destination. And rapid growth on newer chains can outrun the labels that identify exchange wallets. The Week 41 report noted that Base added 37,037 agents since the last snapshot, so chain mix may play a role.
Even so, the data does not show which cause dominates, and the tracker does not claim to know. It shows only that the signal weakened, and that the weakening deserves attention.
The Other End of the Spectrum
Verified funding stays rare. At launch, only 1.0% of agents carried a verified-exchange feeder, and 0.3% had a feeder with confirmed rug pull history. A further 741 agents had been funded by confirmed rug pull operators. The picture is lopsided: the best funding signal is scarce, the unclear one is common and a small but real group traces back to known bad actors.
How Defenders Can Respond
Raise review thresholds when the unknown-feeder share rises. Cap value for unknown-feeder agents instead of blocking them outright, since some privacy-minded operators are legitimate. Prefer agents whose funding chain stays on a single traceable path. Our detailed guide to funding-chain risk for AI agents explains the signal in depth.
How to Read a Weekly Report in Five Steps
A weekly report packs many numbers into a short post. In addition, a simple routine helps readers extract the signal quickly. The five steps below take about ten minutes.
Step 1: Start With the Median
The median trust of new agents is the headline of quality. Compare it with the tier boundaries. A median below 200 sits in the Untrusted tier or at the floor of Elevated Risk. Moreover, a median between 400 and 599 sits in Provisional, and a median above 800 sits in Sovereign. Next, compare the number with the previous week and with the long-run range of roughly 101 to 918.
Step 2: Check the Owner Count
Owners show how many independent parties stand behind the registrations. A week with many registrations and few owners deserves suspicion. Furthermore, a week with many registrations and many owners suggests broader participation. Dividing registrations by owners gives the agents-per-owner ratio, which makes the comparison easy.
Step 3: Read the Flag Shares
Flag shares explain why the median moved. A rising farm share, a rising unknown-feeder share or rising delegation each points to a different cause. When several flags rise together, a coordinated operator probably drove the week.
Step 4: Look at the Chains
Chain mix can shift the picture. The Week 41 report noted that Base added 37,037 agents since the previous snapshot. A chain with a young ecosystem and fewer exchange labels may produce more unknown feeders. Reading the chain breakdown helps separate structural effects from operator effects.
Step 5: Decide What Changes
The last step turns reading into action. Ask whether any trigger fired. A ratio above 2.0, a median at or below 200 or a jump in the unknown-feeder share may justify tighter limits for sensitive access. If nothing fired, note the numbers and move on.
What Each Tier Looks Like in the Registry
The five tiers carry different meanings for counterparties. Looking at the tier mix shows what kind of registry a week produced.
| Tier | Score | What counterparties usually do |
|---|---|---|
| Sovereign | 800-1000 | Grant full autonomous access, including large-value flows |
| Trusted | 600-799 | Allow standard integrations with monitoring available |
| Provisional | 400-599 | Require monitoring and keep to low-risk workflows |
| Elevated Risk | 200-399 | Restrict size and speed, with real-time monitoring |
| Untrusted | 0-199 | Block at the access control layer |
At launch, 20.9% of 274,792 agents were Sovereign, 12.7% Trusted, 14.6% Provisional, 25.8% Elevated Risk and 26.0% Untrusted. The shape has two peaks. A large group sits at the top, a larger group sits at the bottom and fewer agents sit in the middle. The Week 29 report saw the same shape across 317,589 agents, with 27.5% Untrusted and 21.3% Sovereign.
Why the Middle Is Thin
The thin middle has a simple explanation. Scores respond strongly to a few features. A verified-exchange feeder and a clean owner push an agent toward Sovereign. Likewise, a fraud-linked feeder or a farm flag pushes it toward Untrusted. Few agents fall into the ambiguous middle, because the strongest signals tend to agree.
What the Polarization Means
A polarized population makes policy easier at the extremes and harder in the middle. Sovereign agents can receive broad access, and Untrusted agents can receive none. The Provisional and Elevated Risk groups need careful limits, monitoring and review. Teams should spend most of their policy effort on that middle band, because that is where judgment matters.
The Weekly Median Versus the Whole Population
The weekly median describes new registrations. Beyond that, the tier mix across the whole index describes the stock. The two can differ. A week of weak new registrations lowers the median without changing the stock much, because the stock holds more than half a million agents. Over many weeks, though, the weekly pattern shapes the stock. Defenders should watch both: the flow tells them what is arriving, and the stock tells them what already sits in their integrations.
Why Open Registries Attract Fleets
The patterns in the tracker follow from the economics of open registration. Three features make fleets attractive.
Low cost. Registering an agent costs a small amount of gas. An operator can register thousands for the price of a modest budget. When the cost per identity falls close to zero, the number of identities loses meaning.
Potential reward. Registry presence can unlock rewards, incentives and integrations. A single operator that registers many agents can claim many rewards if the programs do not detect the link.
Weak accountability. An agent has no reputation at registration. Operators lose nothing when they abandon an agent, so they have little reason to keep any single one in good standing.
These features create the conditions for farms. A registry that charges more, vets applicants or links identities to accountable parties would shift the balance, but it would also lose the openness that makes ERC-8004 useful. For that reason, independent scoring plays an essential role. It adds accountability from outside, without changing the open design.
Pattern 5: Delegation Growth
A fifth signal deserves a place next to the four main patterns. EIP-7702 delegation, which lets an ordinary account hand execution to contract code, rose 33.8% between Week 35 and Week 40. The tracker marks delegated owner accounts with the EIP7702_DELEGATED flag, and the Week 40 report called out the increase. At launch, 7.6% of indexed agents carried the flag.
Why Delegation Matters
Delegation has legitimate uses. It lets an account batch transactions, sponsor gas for others and add features that simple key pairs lack. Many honest teams use it for exactly these reasons.
The flag still deserves attention. A delegated account can do more than a plain account, and a counterparty cannot predict its behavior from the key alone. The contract code behind the delegation defines what the account does. Delegation next to an unknown feeder or a farm flag raises more concern than delegation by itself.
How Defenders Can Respond
Treat delegation as a prompt to look closer, not as a verdict. Review the delegated contract when the stakes are high. Combine the flag with the others, and weigh the group as a whole. A delegated account with a verified-exchange feeder and a long history looks different from a delegated account with an unknown feeder and a fresh start.
How the Patterns Reinforce Each Other
The patterns do not occur in isolation. They feed one another, and a single operator-driven wave can produce all of them in one week.
- Concentration bursts bring many agents from few owners.
- Few owners with many agents are more likely to carry the farm flag.
- Farms prefer opaque funding, which raises the unknown-feeder share.
- Opaque funding and weak histories lower trust scores.
- Lower scores pull down the weekly median.
Week 31 and Week 38 both showed the chain in action. Each combined a high agents-per-owner ratio with a median of 200. Week 41 showed it again, with a record-low median and a rising unknown-feeder share. The chain explains why a score should combine several pillars and not rely on one.
This also explains why a registry cannot fix the problem alone. Each registration looks valid, and each owner signs correctly. Only a view across agents, owners and funding sources reveals the pattern. The companion guide on ERC-8004 trust signals shows how the registry and the score divide the work, and the guide on KYA versus agent identity explains where identity stops.
What Fraud Looks Like in an Open Registry
It helps to name what these patterns make possible. The tracker cannot prove intent in any single case. It shows distributions, and distributions show where risk concentrates.
Reputation Farming
Operator-controlled wallets review one another’s agents to look established. The ERC-8004 reputation registry forbids owners from reviewing their own agents, but it cannot see that two wallets share a controller. A farm can therefore build a long list of positive feedback for agents that nobody independent has used.
Incentive Capture
Many agents from one operator claim programs that were built for independent users. Each claim looks valid on its own. The pattern across claims shows the operator.
Disposable Agents
An operator creates agents, uses them for a harvesting action and abandons them. The creator’s record then moves to a new wallet, and the cycle repeats. Creator and feeder checks aim to link the new wallet back to the old one.
Laundered Credibility
A creator with a bad record funds a clean-looking owner wallet. The owner looks new and innocent. In practice, the feeder shows the link.
Counterparty Exposure
Honest platforms integrate a farm agent and take on its risk. They may route user funds to it, or they may rely on it for a service. When the agent misbehaves, the platform bears the cost.
Misleading Claims
An agent describes sophisticated capabilities in its registration file and delivers nothing of the kind. The study discussed in our article on how investors should evaluate AI trading agents supports this point. A May 2026 paper from researchers affiliated with Pantera Capital, Stanford, IC3 and Ava Labs examined more than 1,900 AI-tagged crypto projects and found that even agents with fully public wallets could not always be verified as autonomous.
A Defender’s Playbook
The table below summarizes each pattern, its early warning sign and a defensive response. Each team should tune thresholds to its own exposure.
| Pattern | Early warning sign | Defensive response |
|---|---|---|
| Concentration burst | Agents per owner above 2.0, falling owner count | Aggregate limits by owner and by feeder |
| Low-trust floor | Weekly median at or below 200 | Raise the minimum tier for sensitive access |
| Persistent farms | Farm share above 15% | Require fleet checks before onboarding |
| Untraceable funding | Unknown-feeder share rising | Cap value for unknown-feeder agents |
| Delegation growth | EIP-7702 delegation rising | Review delegated accounts before granting permissions |
| Reputation farming | Many positive reviews from young, linked wallets | Weight feedback by reviewer quality |
Turning the Playbook Into Policy
A playbook only helps when it becomes policy. Teams can take four steps.
- Read the tracker weekly. Note the median, the agents-per-owner ratio and the flag shares.
- Set triggers. Decide which readings tighten policy, for example a ratio above 2.0 or a median below 200.
- Write rules by tier and flag. Combine tiers with flag overrides for each access level.
- Review monthly. Compare outcomes by tier, and adjust thresholds with data.
How Different Teams Can Use the Tracker
The same weekly report serves different purposes for different teams.
Risk and Security Teams
Risk teams can follow the share of Elevated Risk and Untrusted agents, the farm share and the unknown-feeder share. When these numbers rise, the team can tighten policy before losses appear. Security teams can also use the tracker as an early warning, because registration bursts often come before abuse.
Protocol Builders
Protocol builders can set minimum tiers for agent access and review them against the weekly median. When the median falls to a record low, as it did in Week 41, builders may raise minimums for sensitive features. Builders can also add fleet limits that count linked agents together.
Marketplace and Registry Operators
Operators of marketplaces can rank listings by tier and show flags next to each listing. They can also publish quality metrics next to volume metrics, so that visitors see more than a count of agents. The overview of the agent trust infrastructure race shows how different providers approach this need.
Researchers and Analysts
Researchers can use the weekly series as a public dataset on agent registry quality. It covers more than thirty weeks of registrations, owner counts, medians and flag shares. The dataset supports studies of Sybil behavior, registry design and incentive abuse.
Investors and Strategic Partners
Investors can use the tracker as evidence that agent trust infrastructure is a real, measurable problem. A registry with more than half a million entries and a record-low median trust is a market that needs a trust layer. Investors can also use it as a diligence tool. Ask any agent project to show where its agents sit in the tier distribution and who funds them.
Three Reading Exercises
The exercises below use hypothetical weekly readings to show how a defender might respond. However, the numbers are invented for practice, and they do not describe real weeks.
Exercise 1: High Volume, High Ratio, Low Median
A hypothetical week shows 30,000 new agents from 9,000 owners, so the ratio reaches 3.3. The median trust sits at 180. Notably, the unknown-feeder share has risen by several points, and the farm share has ticked up.
The pattern matches a concentration burst. A defender would aggregate limits by owner and by feeder, raise the minimum tier for vault and treasury access and delay any grant of new permissions to agents that registered during the week. The defender would also check whether the burst concentrates on one chain, because a chain-specific burst may point to one operator’s campaign.
Exercise 2: Low Volume, Low Ratio, High Median
A second hypothetical week shows 4,000 new agents from 3,800 owners, so the ratio sits near 1.05. The median trust reaches 700. In practice, the farm share falls and the unknown-feeder share stays flat.
This week looks healthy, but the sample is small. A defender would note the improvement, keep the policy unchanged and wait for confirmation from another week. By contrast, a single good week does not justify loosening limits, since the median swung from 918 to 572 within one week in the real series.
Exercise 3: Medium Volume, Medium Ratio, Falling Median With Rising Unknown Funding
A third hypothetical week shows 12,000 new agents from 8,000 owners, so the ratio is 1.5. The median falls 40%, and the unknown-feeder share rises sharply.
Overall, the pattern resembles Week 41 in spirit. Concentration is moderate, but funding quality fell. A defender would cap value for unknown-feeder agents, ask operators of high-value integrations to document their funding structure and check whether the chain mix changed. The defender would not block unknown-feeder agents outright, since some of them are legitimate.
What the Exercises Share
All three exercises use the same method. Read the median, the ratio and the flags together, ask what pattern they suggest and choose a proportionate response. The response scales with the evidence, so a mild signal triggers a mild change.
Common Objections and Honest Answers
Readers raise a few objections when they first meet this kind of analysis. Each deserves a direct answer.
“Isn’t This Just Noise?”
Some weekly movement is noise. The median swings, and a single operator can move it. But several patterns repeat across weeks. Concentration bursts appeared in Weeks 31 and 38 with the same signature. Farm shares stayed between roughly 16% and 21% across the series. Noise does not repeat with such consistency.
“Won’t Operators Just Adapt?”
Operators will adapt, and the tracker will follow them. Adaptation has a cost. An operator that spreads funding across many verified exchange accounts pays in time and identity checks. However, an operator that registers fewer agents per owner gives up scale. Each adaptation makes abuse more expensive, which is the point of a trust layer.
“Does a Low Score Mean the Agent Is a Scam?”
No. A low score means that the evidence points to higher risk. Honest operators sometimes score low because they are new, because they use privacy-preserving funding or because they share infrastructure with other projects. For that reason, policy should respond to low scores with limits and review, and it should give operators a way to improve.
“Why Trust a Vendor’s Own Tracker?”
Readers should not trust any single source blindly. ChainAware publishes the measures, the definitions and the coverage limits, so that others can check them. The underlying data, such as registrations and owner addresses, comes from public chains, and independent analysts can reproduce much of it. Competing scorers can offer different methods, which helps the market. The comparison in the agent trust infrastructure race lays out how those methods differ.
“What About Agents That Never Register?”
Many agents operate without any ERC-8004 registration. The tracker cannot see them. Counterparties that deal with unregistered agents need other evidence, such as wallet history and funding. The same pillars apply, because the owner wallet and its feeder exist whether or not the agent registered. Furthermore, the Prediction MCP can score any wallet, not only registered agents.
Methodology Notes on the Score Behind the Tracker
The tracker rests on the Agent Trust Score, so a short description of the score helps readers interpret the weekly numbers.
Scores run from 0 to 1,000. Three pillars drive it. The first is the owner wallet’s fraud probability, which comes from ChainAware’s behavioral models. These models read how a wallet acts and flag patterns that resemble past fraud, even when nobody has reported the wallet. The second pillar is the feeder address, the source of the owner’s first funds. Likewise, the third is the creator’s criminal record, which covers rug pulls and honeypot deployments. A fleet-level view then compares agents with one another to detect farms.
Rules shape how the pillars combine. A feeder with confirmed fraud history hard-suppresses the score. By contrast, a verified-exchange feeder lifts it, though only when other evidence agrees. Flags travel with the score so that readers can see why it landed where it did.
The score reflects evidence available at indexing time, so it updates as new evidence arrives. Weekly numbers therefore describe the registry as it looked when ChainAware computed them. The wallet forensics article describes the deeper review that analysts can run on any owner wallet that raises a concern.
How to Read the Numbers Without Fooling Yourself
Weekly data invites overreading. A few habits keep the analysis honest.
Watch Small Bases
Percent changes on small weekly bases can look dramatic. Week 39 registered 5,720 agents, and a rise to 6,893 in Week 40 appears as a 20.5% jump, even though the absolute change is about 1,200 agents. Read percent changes next to the absolute numbers.
Read Medians Next to Owner Counts
A median describes the middle agent. It does not describe the whole week. One large operator can move the median by registering thousands of similar agents, as the swing from Week 36 to Week 37 showed. Reading the median next to the owner count and the tier mix reveals whether a few operators drove the result.
Compare Weeks to Ranges, Not to Single Points
A record high or low draws attention, but a range tells more. Median trust in Weeks 34 and 35 sat at 563 and 573, and then it rose to 918 and fell to 572 within two weeks. The range between 101 and 918 over the series is wide, so no single week predicts the next.
Remember What the Index Covers
The tracker covers agents that ChainAware has indexed across Ethereum, BNB Smart Chain, Base and Avalanche C-Chain. It does not cover every agent everywhere. In addition, it also reflects the evidence available at indexing time, and scores can change later. A feeder was traced for about 38% of indexed agents, so funding evidence is missing for many.
Treat Flags as Patterns, Not Verdicts
Flags describe risk patterns. A farm flag signals shared funding or ownership structure, and an unknown-feeder flag signals an untraceable source. Neither proves wrongdoing. They justify limits and review, and they should not trigger automatic punishment.
Lessons for Registry Designers and Standards Authors
The tracker also offers advice to those who build registries and standards. Three lessons stand out.
First, publish quality metrics next to volume metrics. A count of agents says little, whereas a count of independent owners with a trust distribution says much more. Registries that publish only volume invite the wrong conclusions.
Second, make fleet relationships visible. A registry that exposes shared funding and registration timing helps every downstream scorer. The ERC-8004 design already stores owner addresses and agent wallets on-chain, which gives scorers a solid foundation. Additional signals about registration batches and shared controllers would make fleet detection easier.
Third, treat reputation inputs as untrusted by default, and weight them by the reviewer’s own record. The specification itself expects reputation systems to filter by reviewer. In practice, a weighting scheme should discount feedback from young wallets, wallets that share a feeder with the agent’s owner and wallets that review only one operator’s agents.
None of these steps requires central control. They require better data design, and they would make every integrator’s job easier. Importantly, they preserve the neutrality that makes an open registry valuable.
Free Tool
See Where Your Counterparties Sit in the Tier Distribution
Look up the agents you already deal with and compare them with the registry-wide picture. It takes minutes and costs nothing.
Try the Agent Trust Score free ↗Connecting Registry Patterns to Payments and Commerce
The patterns in an on-chain registry preview problems that other agent ecosystems will face. Agentic commerce is moving into card payments and wallet-based checkout, and the same dynamics apply there: cheap identities, fleets of agents and opaque funding.
Several efforts address parts of the problem. Trulioo describes a Digital Agent Passport that carries an agent’s origin, legitimacy, authorization and consent, as its Know Your Agent explanation sets out. Google’s Agent Payments Protocol uses signed mandates to record what users authorized. OpenAI and Stripe’s Agentic Commerce Protocol lets agents pay with a shared payment token, as Payments Journal reported. Each effort covers identity, authorization or transport.
None of them measures how an operator behaves with money. A passport proves origin, a mandate proves permission and a token proves a payment route. The tracker shows what happens when only those layers exist: fleets, concentration and opaque funding appear anyway. A behavioral layer completes the picture. Moreover, a commentary on the liability of agentic commerce, in its deep dive, argues that traditional human signals vanish when software buys on a user’s behalf. That piece is opinion rather than settled rule, yet its point holds. When human signals vanish, risk teams need signals that describe the agent and its operator.
The overview of the Web3 agentic economy explains why machine-readable trust becomes core infrastructure, and the guide to Web3 trust verification systems maps the five categories of trust problems that protocols face.
What to Watch in the Coming Weeks
Several questions will shape the next reports.
- Will the unknown-feeder share keep rising? A continued rise would weaken the funding signal further.
- Will delegation growth continue? More EIP-7702 accounts would change how teams read owner wallets.
- Will registrations recover toward Week 34 levels? If they do, the trust mix will show whether quality follows.
- Will median trust bounce back from 101? A recovery to the Provisional tier would suggest that honest registrations returned.
- Will new chains change the pattern? Mantle support is in progress, and each new chain brings its own operator mix.
- Will agents per owner stay high? A ratio above 2.0 has marked concentration in past weeks.
Book a Demo
Put Weekly Registry Signals Behind Your Agent Access Rules
Bring your use case, and the ChainAware team will show how tiers, flags and fleet limits fit your protocol, marketplace or payment flow.
Schedule a demo with ChainAware ↗Why the Tracker Data Can Be Trusted as Evidence
The tracker scores every indexed agent from on-chain behavior only, with no reviews or self-reported inputs, so a fleet cannot vote its way up. In addition, the underlying models are ChainAware’s own: the company reports 95% accuracy for its per-address fraud model, verifiable through ScamDB, and its rug pull model predicted 90.1% of cases before they happened in a documented PancakeSwap test. Even so, attackers’ addresses and feeders pass through the same fraud detection, so abnormal behavior lowers their scores. For that reason, the weekly numbers describe predicted risk and not a popularity contest.
Key Facts at a Glance
- ChainAware’s weekly Agent Trust Tracker follows ERC-8004 agents across Ethereum, BNB Smart Chain, Base and Avalanche C-Chain.
- By Week 41 of 2026, the index held 568,590 agents.
- Week 34 set the registration record at 31,979 new agents.
- The highest median trust, 918, came in Week 36, and Week 41 set the lowest since Week 5, 101.
- Weeks 31 and 38 showed concentration bursts, with agents per owner at 2.54 and 2.30.
- Farm detection flagged 21.1% of agents at launch and 16.12% in Week 40.
- The unknown-feeder share nearly doubled to 12.84% in Week 41.
- EIP-7702 delegation rose 33.8% between Week 35 and Week 40.
Frequently Asked Questions
What does the Agent Trust Tracker measure?
It reports weekly registrations, unique owners, agents per owner, median trust of new agents, tier mix and flag shares for indexed ERC-8004 agents.
What is agents per owner, and why does it matter?
It is the number of new agents divided by the number of unique owner wallets. A rising ratio shows that few operators drive growth. Weeks 31 and 38 reached 2.54 and 2.30.
Why did median trust fall to 101 in Week 41?
Registrations rebounded 55.3% to 10,706, but the new agents skewed to low scores, and the unknown-feeder share nearly doubled to 12.84%. The tracker does not claim a single cause.
Are flagged agents fraudulent?
Not necessarily. Flags signal risk patterns such as shared funding or an untraceable source. They justify limits and review, not automatic rejection.
Why does registration volume say little about quality?
Registration is open and cheap, and a few large operators can dominate a week. Week 34 set the volume record while Week 41 set a quality low.
What is a Sybil farm in this context?
A Sybil farm is a group of agents or wallets that one operator controls while presenting them as independent. Farm detection compares funding, timing and ownership across agents.
How can I use the tracker in my own risk policy?
Read it weekly, set triggers such as a ratio above 2.0 or a median at or below 200, and tie those triggers to minimum tiers for sensitive access. Review outcomes monthly.
Does the tracker cover every ERC-8004 agent?
No. It covers agents that ChainAware has indexed across four chains, with Mantle in progress. A feeder was traced for about 38% of indexed agents.
Is the tracker free?
Yes. The tracker posts are public, and the Agent Trust Score is free for public indexed agents, with 1,000 queries per month and no signup. See the Agent Trust Score page for current details.
How do I check an individual agent?
Use the free Agent Trust Score tool, or call the same data through the Prediction MCP and the fraud detection API.
A Short Glossary of Tracker Terms
- ERC-8004: an Ethereum standard for agent discovery and trust, built around identity, reputation and validation registries.
- Agents per owner: new registrations divided by unique owner wallets in a week.
- Median trust: the middle Agent Trust Score among a week’s new registrations.
- Tier: one of five score bands, from Untrusted (0-199) to Sovereign (800-1000).
- Farm-detected: a flag for agents that appear to belong to one operator’s fleet.
- Feeder wallet: the address that first funded an owner wallet.
- Unknown feeder: a feeder whose source could not be traced to a known entity.
- EIP-7702: an Ethereum upgrade that lets an ordinary account delegate execution to contract code.
- Concentration burst: a week when registrations hold up while unique owners fall.
Free Tool
Run Your First Registry Check Today
Look up an ERC-8004 agent, read its tier and flags, and decide what access it deserves. Free to use, with 1,000 queries per month and no signup.
Check an agent on the Agent Trust Score ↗Conclusion: Read the Series, Not Just the Week
A single weekly report shows a snapshot. The series shows a pattern. Volume and quality move independently, concentration bursts repeat, farms stay large, funding gets harder to trace and delegation keeps growing. Together, these patterns describe a registry where cheap identities scale faster than trust.
None of this means that agents are bad. Many registered agents are legitimate, and many operators build honest products. The point is that an open registry cannot tell the two groups apart by itself. Independent evidence has to do that work, and the evidence has to refresh as conditions change.
Start with a small step. Read the latest weekly report, note the median and the agents-per-owner ratio, and compare them with your own counterparties. Then write a rule that ties a trigger to a minimum tier. For the full background, read the launch article, explore autonomous compliance screening, and see how ChainAware Investigation supports a deeper review of any suspicious owner wallet. Token-level risk sits next to agent risk in many integrations, and the Token Audit covers it. In addition, our overview of the 32 Claude sub-agents shows how ChainAware’s own agent fleet applies these checks.
Implications for AI Agent Builders
Builders of AI agents sit on both sides of the tracker. They want counterparties to trust their agents, and they depend on other agents and protocols that they must trust in turn. The weekly data offers practical lessons for both roles.
If You Build Agents
Builders can earn better tiers through ordinary good practice. Fund the owner wallet from a verified exchange account, because the feeder carries real weight. Avoid sharing one funding source across many unrelated owner wallets, since shared feeders look like fleets. Keep owner wallets active and consistent over time, and separate treasury, operating and test wallets.
Builders should also publish what they can prove. A registration file that links to audits, code references and a documented funding structure gives counterparties something to check. Claims without evidence blend into the noise that the tracker describes. Evidence stands out, particularly in a registry where the median new agent scores 101.
Finally, builders should monitor their own standing. A look-up of your own agents once a week costs nothing and shows how counterparties see you. When a score drops, investigate the cause before a partner does.
If You Integrate Agents
Integrators should treat the registry as a discovery layer and the score as a gate. Look up each counterparty before granting access, apply tier-based limits and re-check on a schedule. Keep a log of every decision, so that disputes and audits have a clear record.
Integrators can also let their own agents check counterparties automatically. Through the Prediction MCP, an agent can call the trust score before it pays or delegates. The logic stays simple because the output has a fixed structure. A human cannot sit in a loop that runs thousands of times a day, so machine-to-machine checks matter more every month.
If You Invest in Agents
Investors should ask for the same evidence that counterparties need. Where do the agents sit in the tier distribution? Who funds the owner wallets? How many sibling agents share an operator? A project that answers these questions openly deserves attention, and a project that dodges them has told you something about its priorities.
What a Healthy Agent Profile Looks Like
The tracker describes the registry as a whole, but individual agents can look healthy too. Counterparties can use a short profile as a mental model.
- Traceable owner. The owner wallet has a visible history of ordinary activity, and its fraud probability is low.
- Clear funding source. A verified exchange or a well-understood wallet funded the owner, and no flag marks the feeder as unknown or fraud-linked.
- No fleet signature. The owner runs a small number of agents, and no group of near-identical agents shares its funding.
- Clean creator record. The creator wallet has no rug pull or honeypot history.
- Independent feedback. Reviewers have their own histories, and they review many different agents.
- Consistency over time. Behavior and funding stay stable across re-checks.
Agents that match the profile tend to land in the Trusted or Sovereign tiers. In addition, agents that miss several items land lower, and agents that miss the most important items land in Untrusted. The profile also gives operators a checklist, since each item corresponds to something they can influence.
A Note on Timing and Freshness
Timing affects every reading in this article. The tracker publishes weekly, and the scores behind it update as new evidence arrives. A counterparty that checks an agent today sees today’s evidence, which may differ from the figure in last week’s report.
Freshness matters most for three groups of agents. New agents change quickly, because their histories are short and each new transaction moves the picture. Agents that change owners can shift tiers overnight, since a new owner brings a new funding chain. And agents in fast-growing chains can see their labels improve as exchange and entity databases catch up, which may lift scores that looked low earlier.
For these reasons, policy should treat any score as a dated reading. Store the time of each lookup, set a refresh window that matches the value at risk and trigger a fresh check before large or unusual actions. A score that is a month old is a claim about the past. In addition, a score from this minute is evidence about the present, and the difference can decide whether a protocol approves a request.
The weekly series gives the long view, and a live lookup gives the current one. Teams should use both. The series shows which way the registry moves, and the lookup shows where a specific agent stands today.